Writing report
academic IELTS Writing: Task 1
Overall score
6.00
6.0 of 9.0
Submitted on
Nov 01, 2024 (over 1 year ago)
Writing duration
1974 minutes
Task description
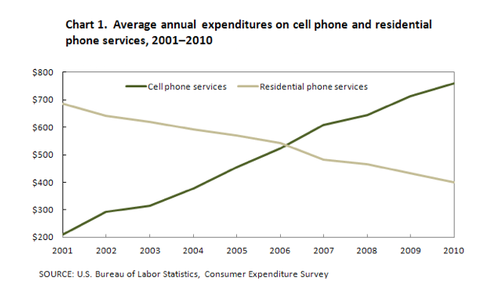
The graph below shows US consumers' average annual expenditures on cell phone and residential phone services between 2001 and 2010. Write a report for a university, lecturer describing the information shown below. Summarise the information by selecting and reporting the main features and make comparisons where relevant. You should write at least 150 words.
You should write a minimum of 150 words.

Task answer
The graph gives the comparison of cell phone services and residential services yearly used and money spend on it during 2001 to 2010.
Overall, it can be seen that with the passage of time expenditures on cell phones increased over years as compare to residential services. Starting from 200$ spent in 2001 to more than 700$ on cell phone services in 2010.
Graph shown that cells phone services were not as much common in 2001 only 200 $ spent on cell phone services and as the time passes the importance of cell phones increased year by year and it become the highly used services in 2010 by spending over 700$ per annum.
While on the other hand, it can be seen that residential phone services were the most used services in 2001 spent around 700$ per annum. As the years passes it become the least used service. Annual expenditures on residential phone services fell from 700$ to 400$ in 2010.
Thus the graph gives the information how the expenditures of cell phone increased by the time and how the use of residential phone services were the most to least used services. This shows how fast the life become day by day and people wants quick services.
Word count:203