Writing report
academic IELTS Writing: Task 1
Overall score
6.00
6.0 of 9.0
Submitted on
Nov 12, 2024 (over 1 year ago)
Writing duration
0 minutes
Task description
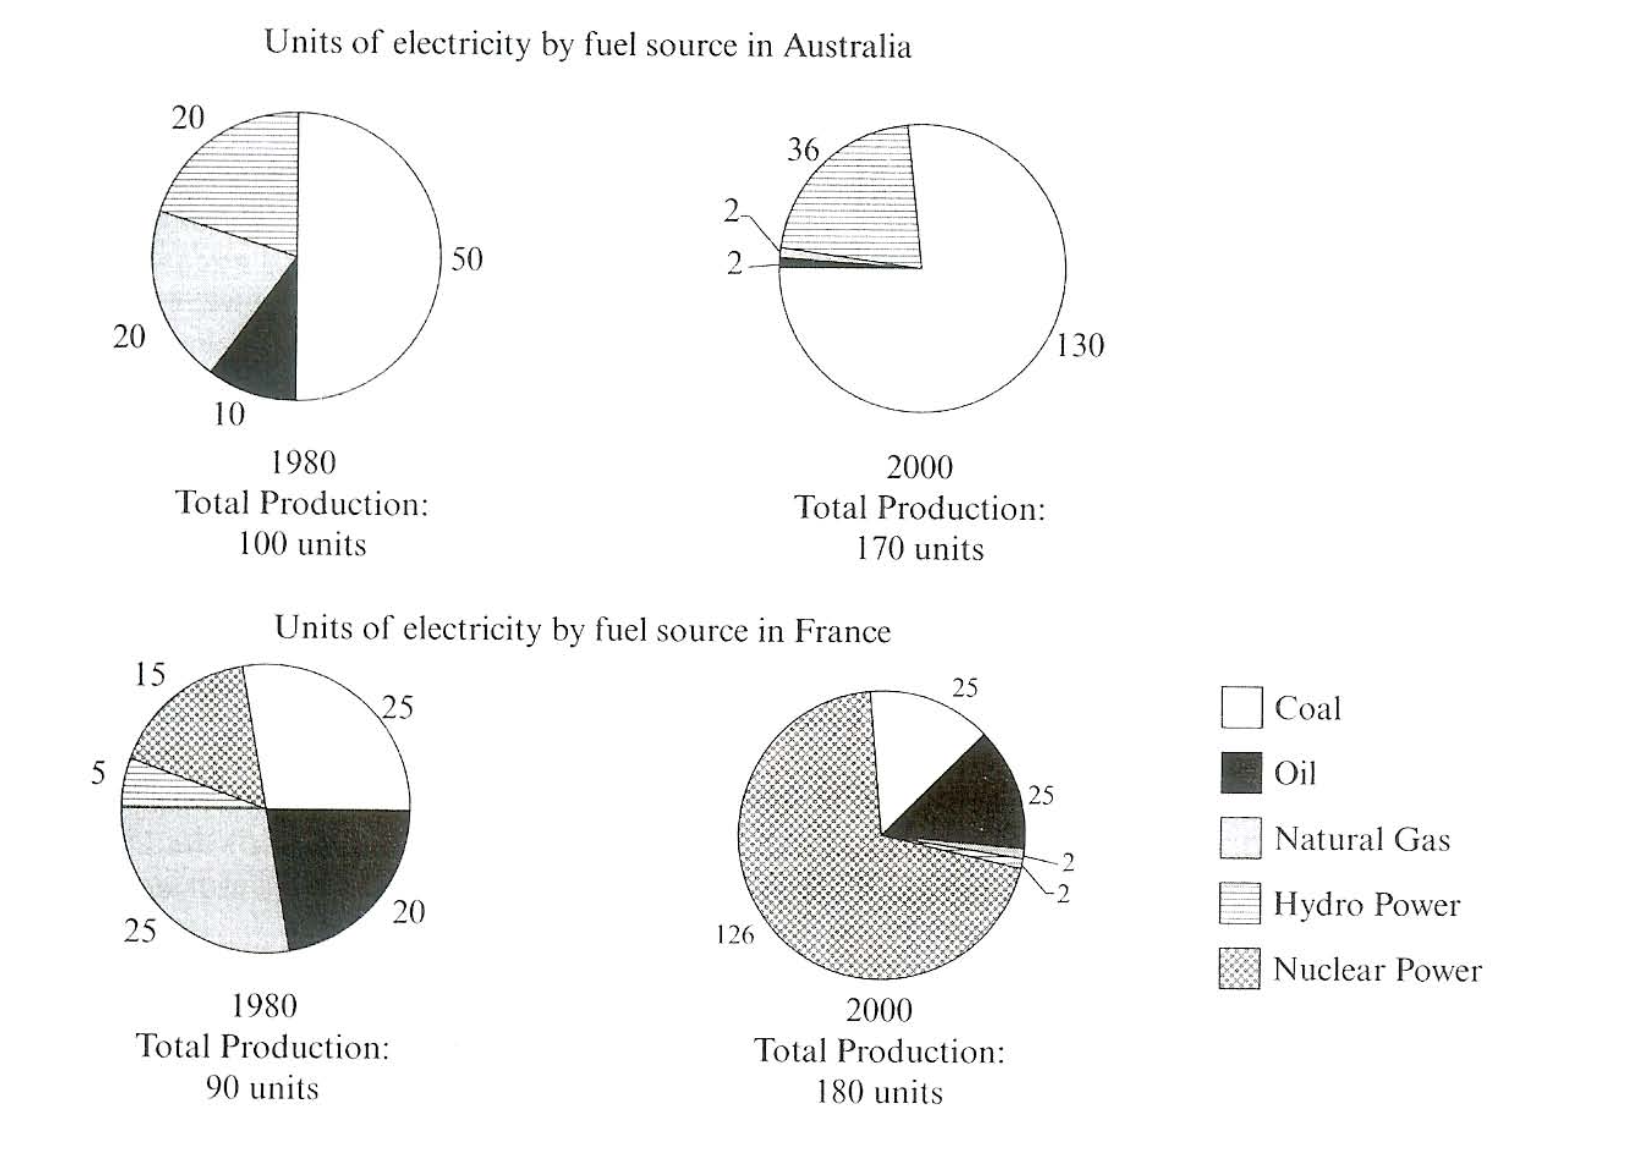
The pie charts below show units of electricity production by fuel source in Australia and France in 1980 and 2000. Summarize the information by selecting and reporting he main features ad make comparisons where relevant.
You should write a minimum of 150 words.

Source: Cambridge 7
Task answer
The pie charts illustrate the amount of electricity produced by five different fuel sources in two countries- Australia and France in 1980 and 2000.
In 1980, Australia had most of its electricity generated from coal; however, France had its highest generation from coal and natural gas. The lowest distribution in France was from hydropower meanwhile, Australia has four times the amount of units distributed.
On the other hand, in 2000, units of electricity in both countries became more with Australia having the most distribution from coal, whereas France got the most distribution from nuclear power.
Overall, Australia depended greatly on coal for generation of its electricity in both years, while France varied in its dependent source in 1980 and 2000.
Word count:119