Writing report
academic IELTS Writing: Task 1
Overall score
7.00
7.0 of 9.0
Submitted on
Nov 26, 2024 (about 1 year ago)
Writing duration
0 minutes
Task description
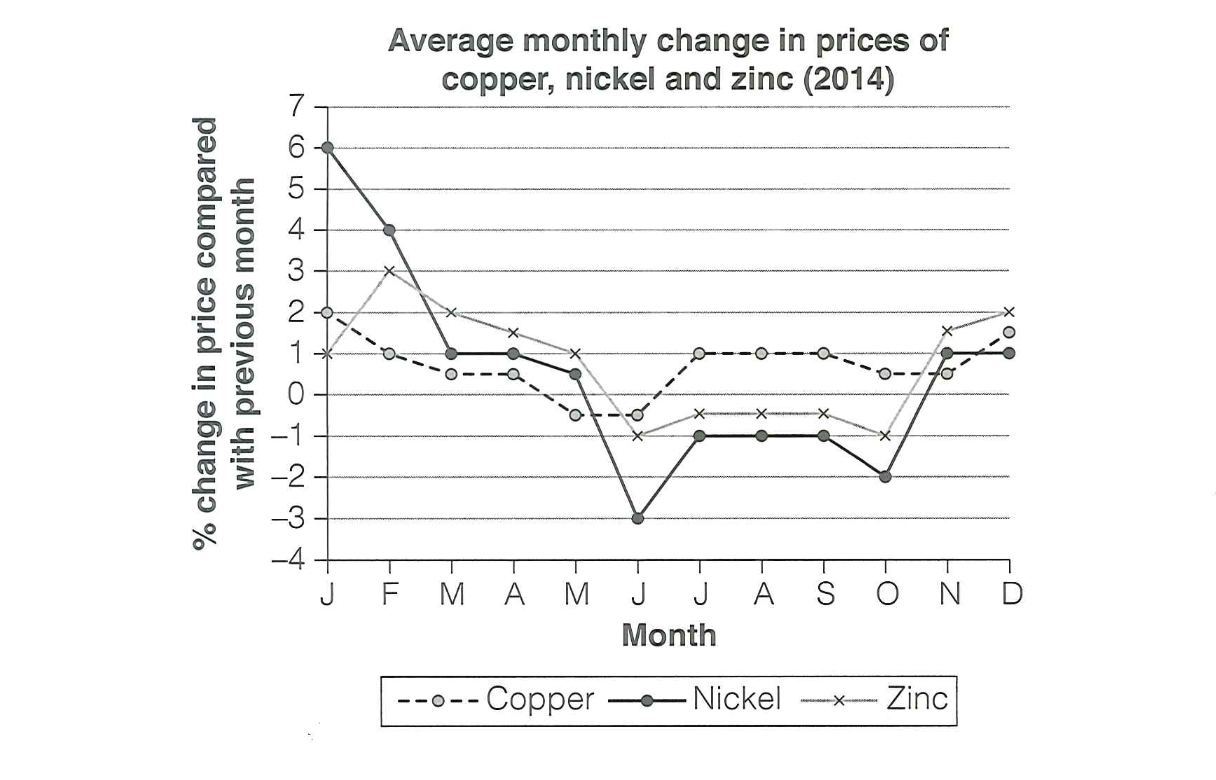
The graph below shows the average monthly change in the prices of three metals during 2014. Summarize the information by selecting and reporting the main features, and make comparisons where relevant.
You should write a minimum of 150 words.

Source: Cambridge 18
Task answer
The graph illustrates the average monthly percentage changes in the prices of copper, nickel, and zinc throughout 2014, compared to the previous month.
The price of copper started high in January, showing a 6% increase compared to the previous month. However, it gradually declined over the following months and dropped to negative values in June (-2%), before stabilizing slightly above 0% in the latter half of the year.
Nickel prices also began the year with a substantial rise (around 4%) and followed a trend similar to copper, with steady declines until June. After reaching a low point in June (around -2%), the prices recovered moderately in the second half of the year, ending just above 0% in December.
Zinc demonstrated the most irregular pattern. The price increase in January was relatively smaller than copper and nickel (about 2%). It fluctuated around 0% from February to June, experiencing a sharp dip in July (nearly -3%). However, unlike the other two metals, zinc prices surged towards the end of the year, reaching approximately 3% in December.
In 2014, while copper and nickel followed similar trends with an initial rise and subsequent decline, zinc exhibited more volatility and ended the year with a significant increase compared to the other two metals.
Word count:204