Writing report
academic IELTS Writing: Task 1
Overall score
6.00
6.0 of 9.0
Submitted on
Nov 30, 2024 (about 1 year ago)
Writing duration
0 minutes
Task description
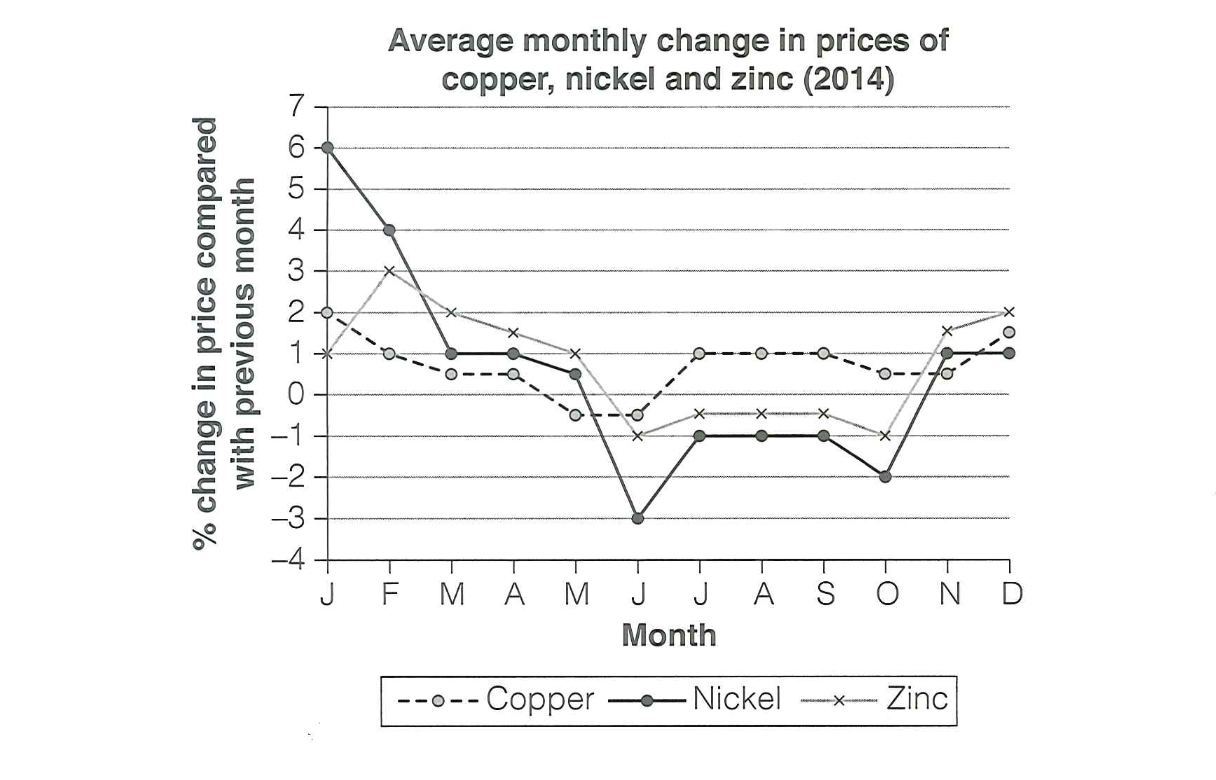
The graph below shows the average monthly change in the prices of three metals during 2014. Summarize the information by selecting and reporting the main features, and make comparisons where relevant.
You should write a minimum of 150 words.

Source: Cambridge 18
Task answer
If we look at the graph, it clearly shows that the metals nickel and copper have relatively higher prices during the first month which gradually starts declining in the next few months. This trend continues to fall till june 2014 and this the prices tend to increase again in July. Another important observation that can be made of all the three metals i.e., nickel, copper and zinc is that their prices remain constant from July to September , and then their prices decrease again in October, which start to increase in the last quarter of 2014. Nickel shows highest fluctuations in prices as compared to other two metals. In short, prices of all the three metals tend to fall during 1st six months, then they become constant for next 3 months, after they they fall again in october but the trend changes in the last three months where the increase in prices of metals can be seen.
Word count:157