Writing report
academic IELTS Writing: Task 1
Overall score
6.00
6.0 of 9.0
Submitted on
Dec 23, 2024 (about 1 year ago)
Writing duration
0 minutes
Task description
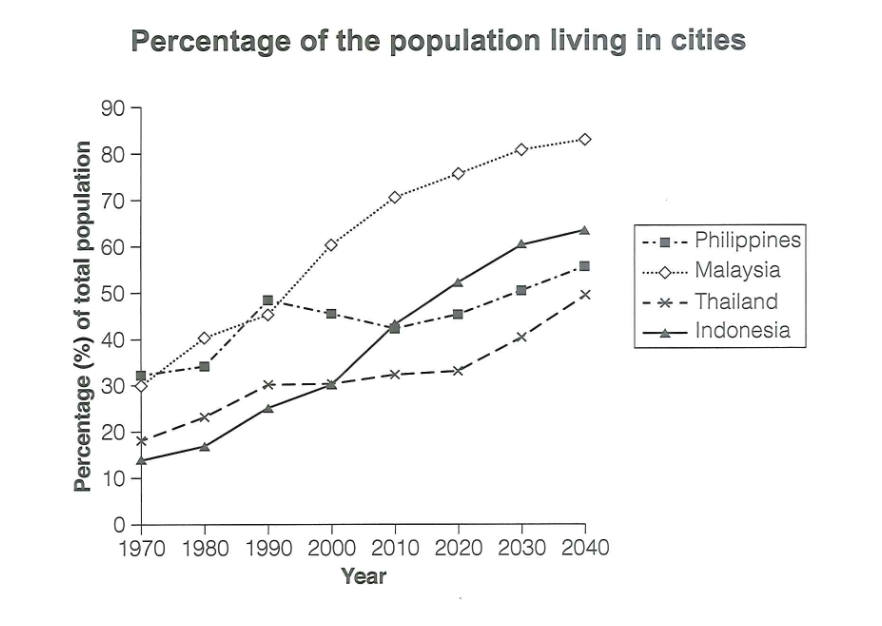
The graph below gives information about the percentage of the population in four Asian countries living in cities from 1970 to 2020, with predictions for 2030 and 2040. Summarize the information by selecting and reporting the main features, and make comparisons where relevant.
You should write a minimum of 150 words.

Source: Cambridge 18
Task answer
The line graph illustrates urban population trends in four Asian countries such as Philippines, Malaysia, Thailand and Indonesia between 1970 and 2040.
Overall, portion of the population residing in urban area increases in all four countries throughout the period. Although from 1970 to 2020, the percentage rose significantly in Malaysia and Indonesia, grew steadily in Thailand and fluctuated in Philippines, the prediction in the final two decades depicts increasing trend in all countries.
In 1970, only 30% of total population lived in cities in Malaysia. After that it continued to increase slowly in the next two decades before experiencing the sharpest rise between 1990 and 2000. The rate is assumed to increase steadily in future as well. A similar upward trend can be observed in Indonesia. Starting from the lowest percentage in 1970, Indonesia is predicted to have the second largest percentage among the four countries.
In contrast, Philippines witnessed considerable fluctuations from 1970 to 2010. Starting from around 30% in 1970, it grew to approximately 50% in 1990. This was followed by a decline to almost 40% in 2010. A upward rate is assumed by 2040 for Philippines as well. Meanwhile, Thailand experienced steady decadal rise from 1970 to 1990. It plateaued at this level for the next thirty year. After that it is followed by a sharp upward prediction.
Word count:219