Writing report
academic IELTS Writing: Task 1
Overall score
6.50
6.5 of 9.0
Submitted on
Jan 06, 2025 (about 1 year ago)
Writing duration
0 minutes
Task description
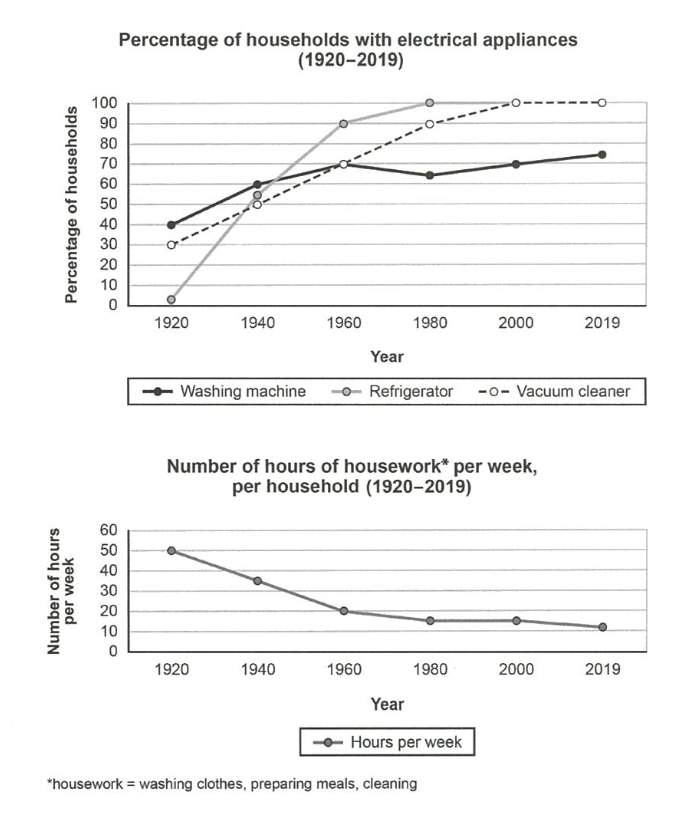
The charts below show the changes in ownership of electrical appliances and amount of time spent doing housework in households in one country between 1920 and 2019. Summarize the information by selecting and reporting the main features, and make comparisons where relevant,
You should write a minimum of 150 words.

Source: Cambridge 16
Task answer
The line graphs illustrate making changes to possession of three electrical appliances, including washing machine, refrigerator, and vacuum cleaner, and the figure for time allocated doing household chores in one country from 1920 to 2019.
Overall, the figure for households using electrical appliances increased, while the number of hours each week dreased. The lowest percentage in the usage of an electrical device stood for refrigerator and hours per week per family was in the year of 2019.
The total households using refrigerators in 1920 were a little less than 1 percent. This figure witnessed a rise dramatically to its peak of 100 percent in 1980 before it plateaued until 2019. From 1920 to 1960, the usage of washing machines saw a rise of 30 percent and hovered around that level until 2010. The percentage of people opting for vacuum cleaners experienced a sharp escalation between 1920 and 2000, a trend that, after 2000, continued till the next 19 years.
The culmination of hosework per week was at 50 hours in 1920. From this time until the end, 2109, there was a decrease to just over 10 hours.
Word count:184