Writing report
academic IELTS Writing: Task 1
Overall score
8.00
8.0 of 9.0
Submitted on
Jan 10, 2025 (about 1 year ago)
Writing duration
67 minutes
Task description
The bar chart below describes some changes about the percentage of people were born in Australia and who were born outside Australia living in urban, rural and town between 1995 and 2010. Summarise the information by selecting and reporting the main features and make comparisons where relevant. You should write at least 150 words.
You should write a minimum of 150 words.

Task answer
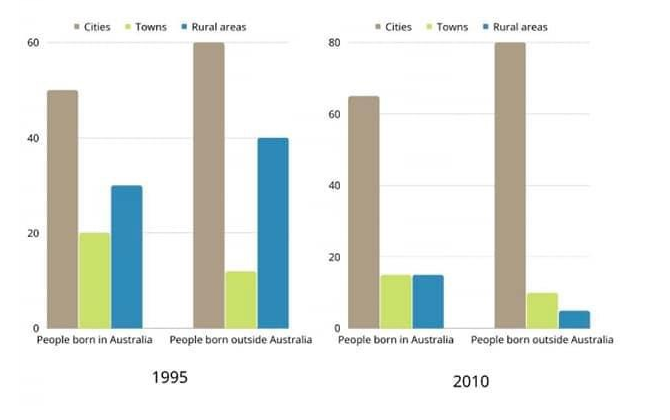
The bar charts compare the percentage of people born in Australia and outside Australia living in cities, towns, and rural areas in 1995 and 2010. The data reveals significant changes in population distribution over time, particularly a shift towards urban living.
In 1995, the majority of both groups lived in cities, with about 50% of people born in Australia and nearly 60% of those born outside Australia residing in urban areas. Rural areas were also a popular choice, accounting for approximately 30% of the Australian-born population and 40% of those born abroad. Towns, however, had the smallest proportion of residents, with figures around 20% for both groups.
By 2010, there was a notable increase in urbanization for both groups. The percentage of Australian-born individuals living in cities rose to 65%, while the figure for those born outside Australia surged to around 80%. In contrast, the rural population declined sharply, with only about 15% of Australian-born individuals and less than 10% of those born overseas living in rural areas. The proportion of people living in towns also decreased slightly for both groups.
Overall, the data highlights a clear trend of urbanization between 1995 and 2010, with cities becoming the dominant residential choice for both Australian-born and foreign-born populations, while rural and town areas experienced a decline in popularity.
Word count:214