Writing report
academic IELTS Writing: Task 1
Overall score
6.50
6.5 of 9.0
Submitted on
Jan 26, 2025 (about 1 year ago)
Writing duration
0 minutes
Task description
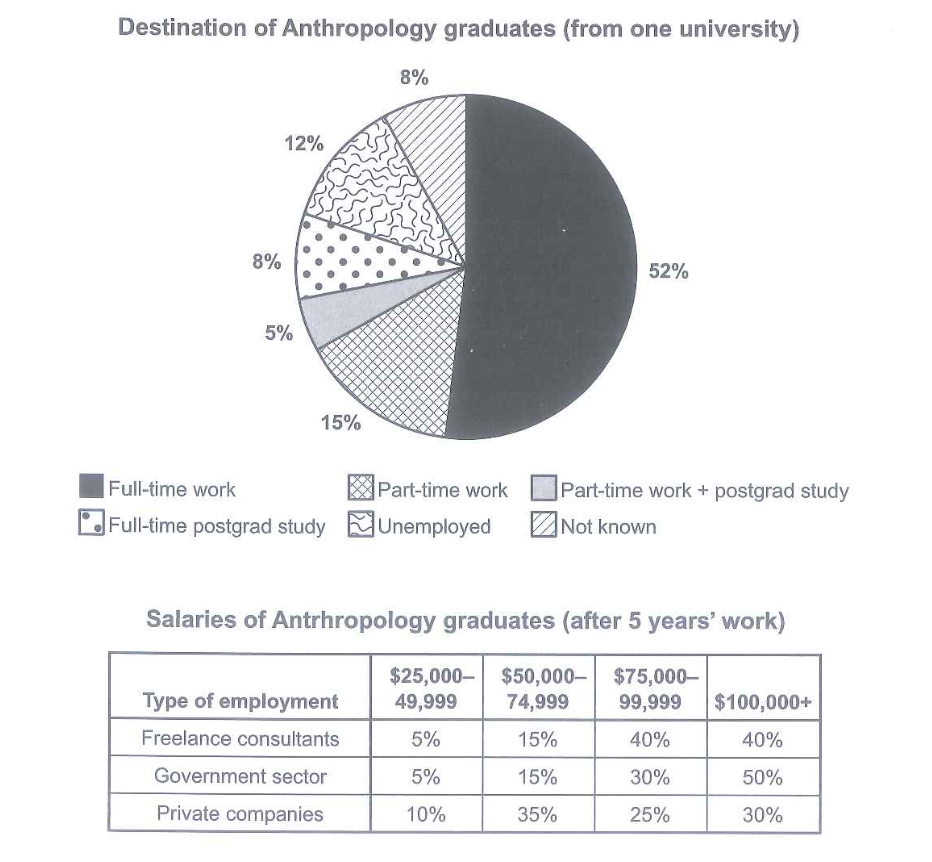
The chart below shows what Anthropology graduates from one university did after finishing their undergraduate degree course. The table shows salaries of the anthropologists in work after five years. Summarize the information bu selecting and reporting the main features, and make comparisons where relevant.
You should write a minimum of 150 words.

Source: Cambridge 15
Task answer
The pie chart illustrates the proportion of junior students one year after their bachelor's, and the table shows the figure for stipends that anthropologists as seniors at work after 5 years.
Overall, full-time jobs rank first among the desired destinations of students, followed by part-time jobs. In addition, the contribution of employed students with a salary of more than 100k stood first.
According to the pie chart, there is a significant difference between the share of the destination of the students in full-time work with just above half on the one hand, and those of part-time work and postgrad study, part-time work, full-time postgrad study, and unemployed students ( 15%, 5%, 8%, and 12%, respectively).
According to the table, in contrast to private companies with a salary of 50k to just under 75 figures (35%), the shares of freelance consultants earning from 75k to just below 100K and more than 100k are exactly equal at 40%. The highest amount of salary of all students goes to the government sector with more than 100k (5o%).
Word count:172