Writing report
academic IELTS Writing: Task 1
Overall score
6.00
6.0 of 9.0
Submitted on
Jan 26, 2025 (about 1 year ago)
Writing duration
0 minutes
Task description
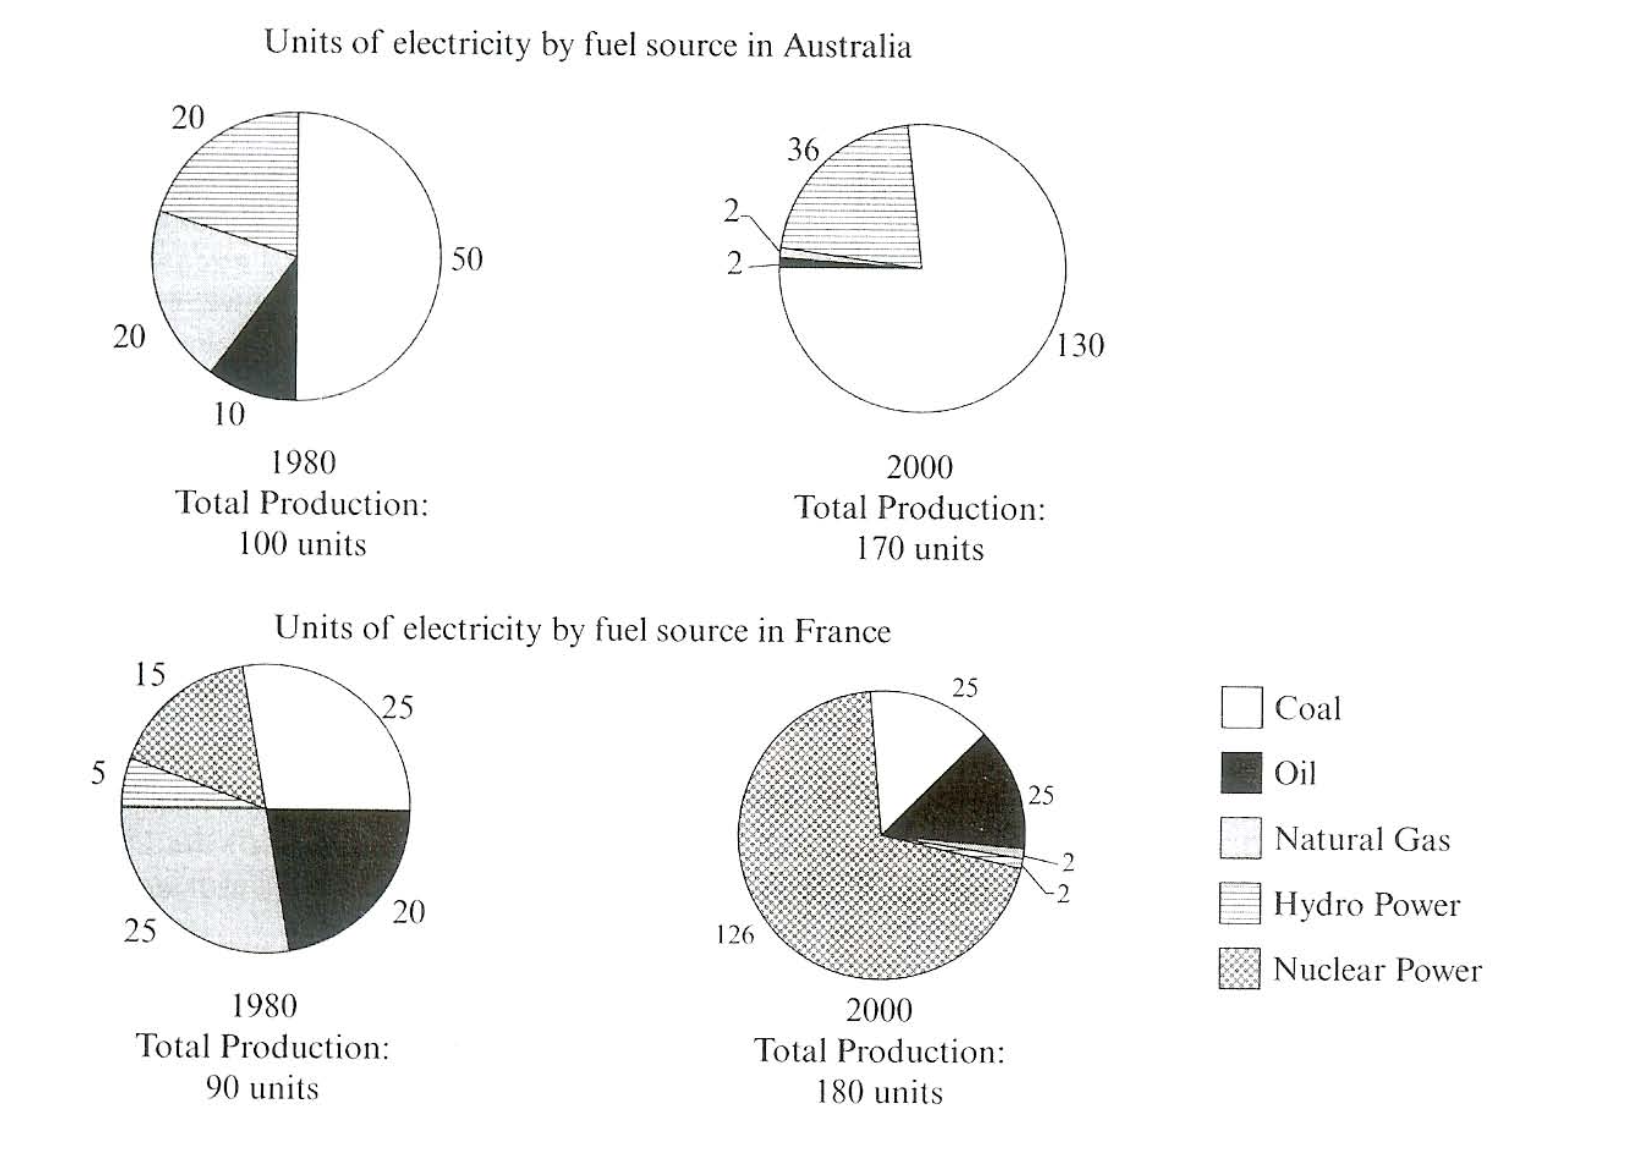
The pie charts below show units of electricity production by fuel source in Australia and France in 1980 and 2000. Summarize the information by selecting and reporting he main features ad make comparisons where relevant.
You should write a minimum of 150 words.

Source: Cambridge 7
Task answer
The diagrams illustrate what shares of electricity is generated by fossil fuels and renewable in France and Australia from 1980 to 2000.
Overall, a majority of electricity produced by coal in Australia over 20 years. In addition, France ranked first in employing nuclear power as a source of electricity generation.
In Australia, The figure for coal stood first in 1980 with 50 units (50U), after which it rose to 10U in 200, and the second highest improvement was in Hydropower, rising from 20U to just above 35. There is a dramatic decline in natural gas, reducing from 20U to 2U.
In France, there was a significant difference, in 200, between the figure for nuclear power 126U on the one hand, and that for coal, oil, natural gas, and hydropower accounted for 25U, 25U, 2U, and 2U, respectively on the other. In 1980, The highest numbers went to Coal which was as high as natural gas 25U.
Word count:153