Writing report
academic IELTS Writing: Task 1
Overall score
6.00
6.0 of 9.0
Submitted on
Feb 03, 2025 (about 1 year ago)
Writing duration
0 minutes
Task description
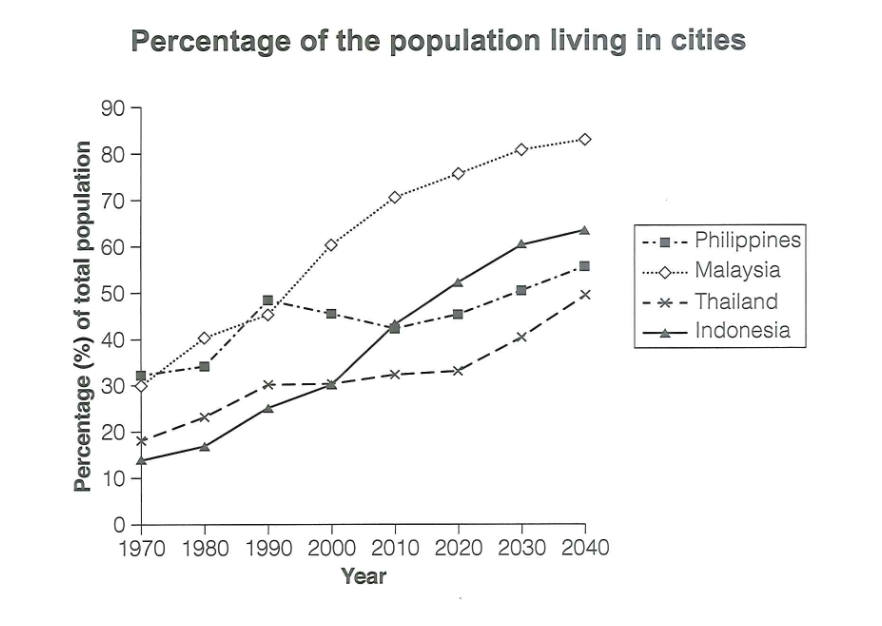
The graph below gives information about the percentage of the population in four Asian countries living in cities from 1970 to 2020, with predictions for 2030 and 2040. Summarize the information by selecting and reporting the main features, and make comparisons where relevant.
You should write a minimum of 150 words.

Source: Cambridge 18
Task answer
The urban population as shown in the graph is experiencing continous increase in population overtime with each deacde. The timeframe for this graph starts from 1970 and ends in 2040 with a 1 decade interval inbetween. Within the graph are 4 countries: Philipines, Malaysia, Thailand, and Indonesia.
The graphs shows that in overall all countries are experiencing growth in urban populations, with the highest urbanization rate being Malaysia which have been increasing since 1970. Following Malaysia in terms of growth are Indonesia and Thailand which is growing in a consistent and stable pace, contrary to the last country, Philiphine, which remains the same on average due to its fluctuations in net population.
Malaysia from the 1970 have been increasing in population at a quick rate, it can be compared to the philipines which have fluctuations in its growth after the 1990s which is only growing at a slower pace, contrary to the years before the 1990s, in which Philipine experienced a sudden increase of 20% more population in the span of 2 decades.
Moving onto Indonesia which have a steady but gradually increasing rate of growth, compared to Thailand's growth that only experience a sudden increase in growth rate after 2020, which can lead to Thailand having the same population as Indonesia in a decade or two after 2040s.
Word count:216