Writing report
academic IELTS Writing: Task 1
Overall score
8.00
8.0 of 9.0
Submitted on
Feb 09, 2025 (about 1 year ago)
Writing duration
0 minutes
Task description
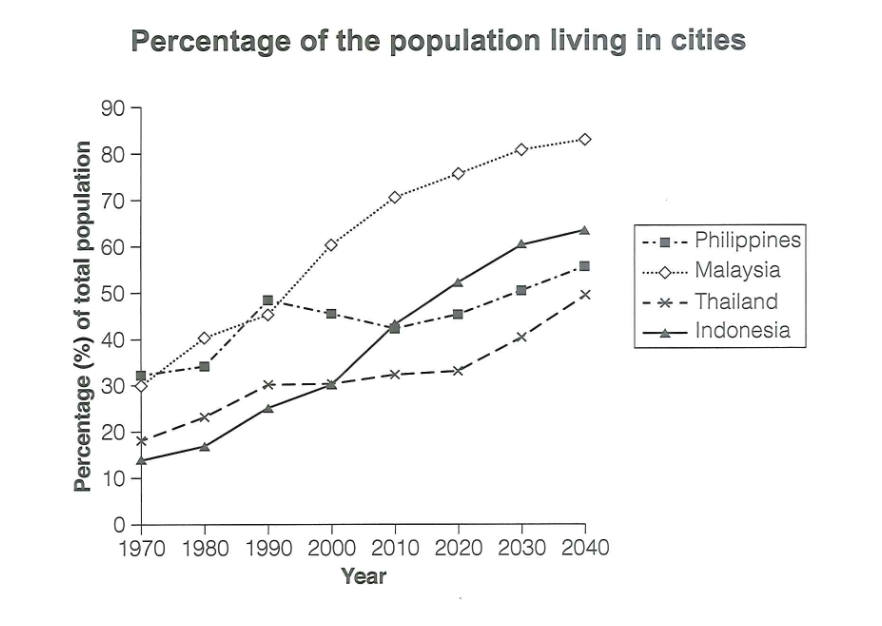
The graph below gives information about the percentage of the population in four Asian countries living in cities from 1970 to 2020, with predictions for 2030 and 2040. Summarize the information by selecting and reporting the main features, and make comparisons where relevant.
You should write a minimum of 150 words.

Source: Cambridge 18
Task answer
The line graph compares the urban populations of four countries between 1970 and 2020, with predicted figures for 2030 and 2024.
Overall, projections show that all countries will witness a dramatic increase in the proportion of city residents, with Malaysia being expected to see the greatest growth.
In 1970, the percentages of urban inhabitants of the Philippines and Malaysia were roughly the same, at around 30%, compared to 20% for Thailand and 15% for Indonesia. Malaysia witnessed the most dramatic increase, with figures rising to nearly 75% by 2020. Indonesia overtook the other two to become the country with the second largest urban population, with nearly half of the total population living in cities in 2020. While the Philippines saw a drop in the proportion of urban residents between 1990 and 2010, Thailand’s figure rose steadily to nearly 30% by 2020.
By 2040, it is predicted that the urban populations of all these countries will grow, with Malaysia still top of the list, at nearly 85%, followed by Indonesia, at more than 60%. The figures for the other two countries are also expected to increase, but at a slower rate, with more than 55% of Filipinos and around 45% of Thai being projected to live in cities by 2040.
Word count:206