Writing report
academic IELTS Writing: Task 1
Overall score
6.00
6.0 of 9.0
Submitted on
Feb 11, 2025 (about 1 year ago)
Writing duration
0 minutes
Task description
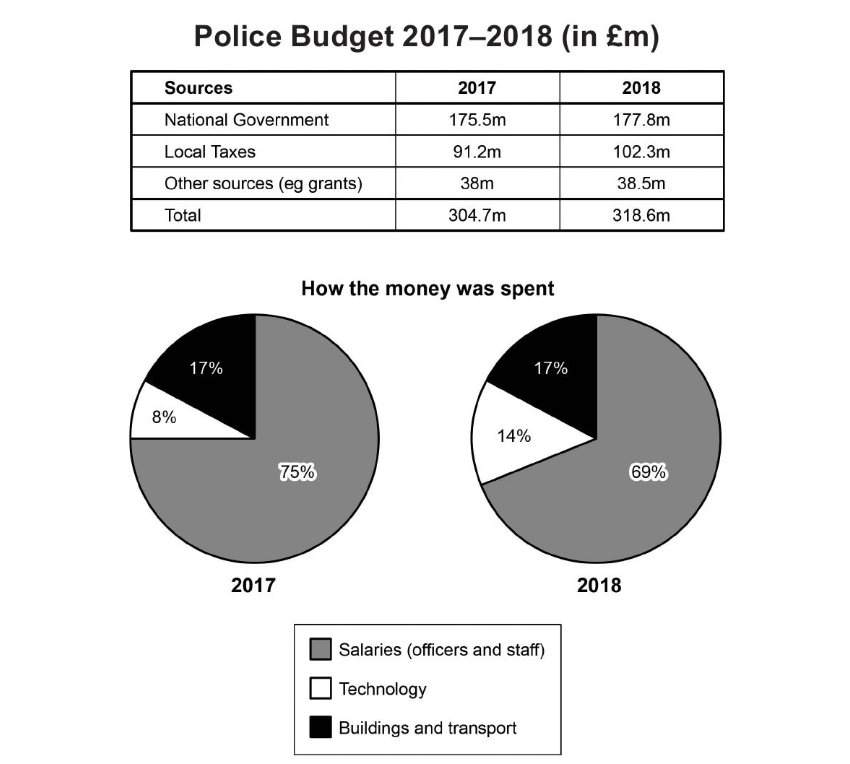
The table and charts below give information on the police budget for 2017 and 2018 in one area of Britain. The table shows where the money came from and the charts show how it was distributed. Summarize the information by selecting and reporting the main features, and make comparisons where relevant.
You should write a minimum of 150 words.

Source: Cambridge 17
Task answer
The table shows that the sources of police budget in one region of Britain in the year 2017 and 2018. Also, the pie chart illustrates how much money expenditured for 3 different categories include salaries, technology, building and transport at the same time.
Overall, it is clear that, the main sources of police budget came from national government, while other sources provided a least money. By the way, the most police budget was spent for salaries and the opposite was true for technology.
Looking at the table in more details, in 2017, the proportion of money came from national government accounted 175,5m and reached a peak at 177,8m in 2018. Meanwhile, standing at 91,2m in 2017, local texes witnessed a slight increase to 102,3m in 2018. The money came from other sources remained stable throughout the period, at roughly 38m.
Regarding the remaining chart, the most notable is that the percentage of money spent for salaries peak at 75% in 2017, but later decreased to 69%. Standing at 8% in 2017, the figure of technology witnessed a slight increase to 14% in the next year. Meanwhile, the percentage of building and transport remain stable throughout the period, which stood at 17%.
Word count:199