Writing report
academic IELTS Writing: Task 1
Overall score
6.00
6.0 of 9.0
Submitted on
Mar 01, 2025 (over 1 year ago)
Writing duration
0 minutes
Task description
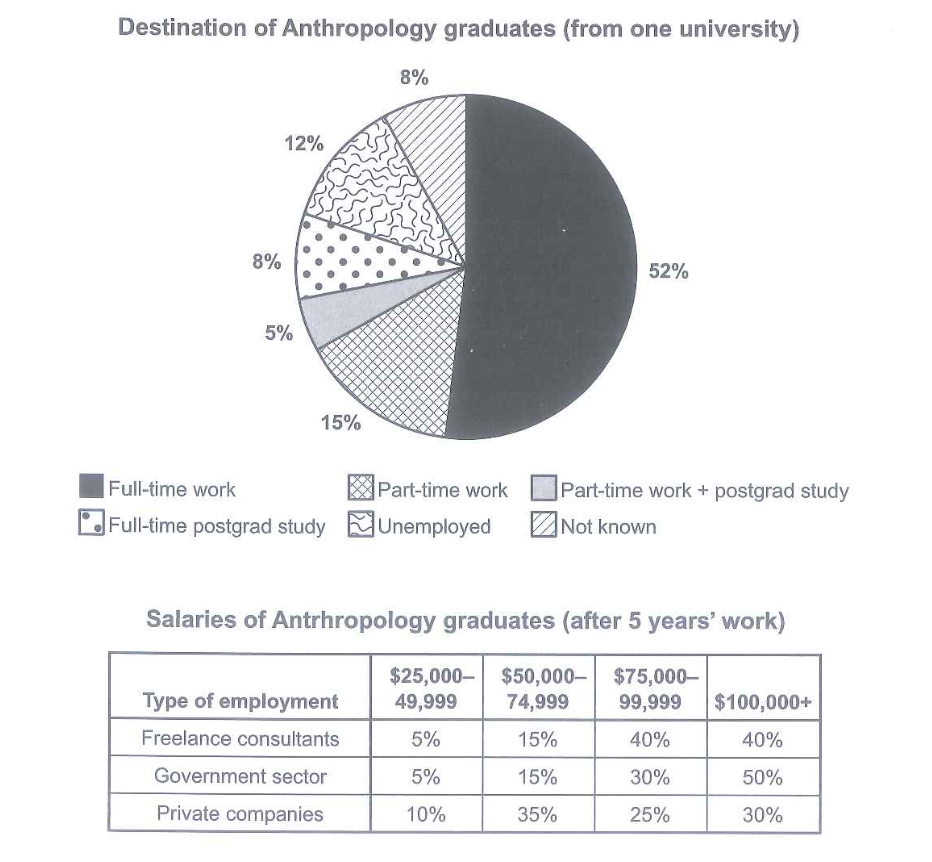
The chart below shows what Anthropology graduates from one university did after finishing their undergraduate degree course. The table shows salaries of the anthropologists in work after five years. Summarize the information bu selecting and reporting the main features, and make comparisons where relevant.
You should write a minimum of 150 words.
Source: Cambridge 15
Task answer
The pie chart and table give information about percentages of the destination of anthropology graduates from one university and amount of earning money after 5 years' work, respectively.
Overall, the rate of full-time work made up a highest among the numbers given, while hit a lowest point was the rate combines between part-time work and postgrad study. After 5 years' work, the percentages of salaries above 100,000 dollars of all employment type.
It is clearly that the figures of full-time work achieved over 50% while part-time work was equal relatively about one-third. The rates of unemployed declined to 3% compared with part-time work. As a same time, the figures of both full-time postgrad study and not known was the same as at 8%. Hitting a lowest was the percentage of part-time work plus postgrad study with 5%.
In the table, comparing the salaries of anthropology graduates including 3 type of employment and earning over 100,000 dollars was always the highest. All of 3 types showed downward trend follow the down level of salaries.
Word count:170