Writing report
academic IELTS Writing: Task 1
Overall score
6.50
6.5 of 9.0
Submitted on
Mar 01, 2025 (over 1 year ago)
Writing duration
0 minutes
Task description
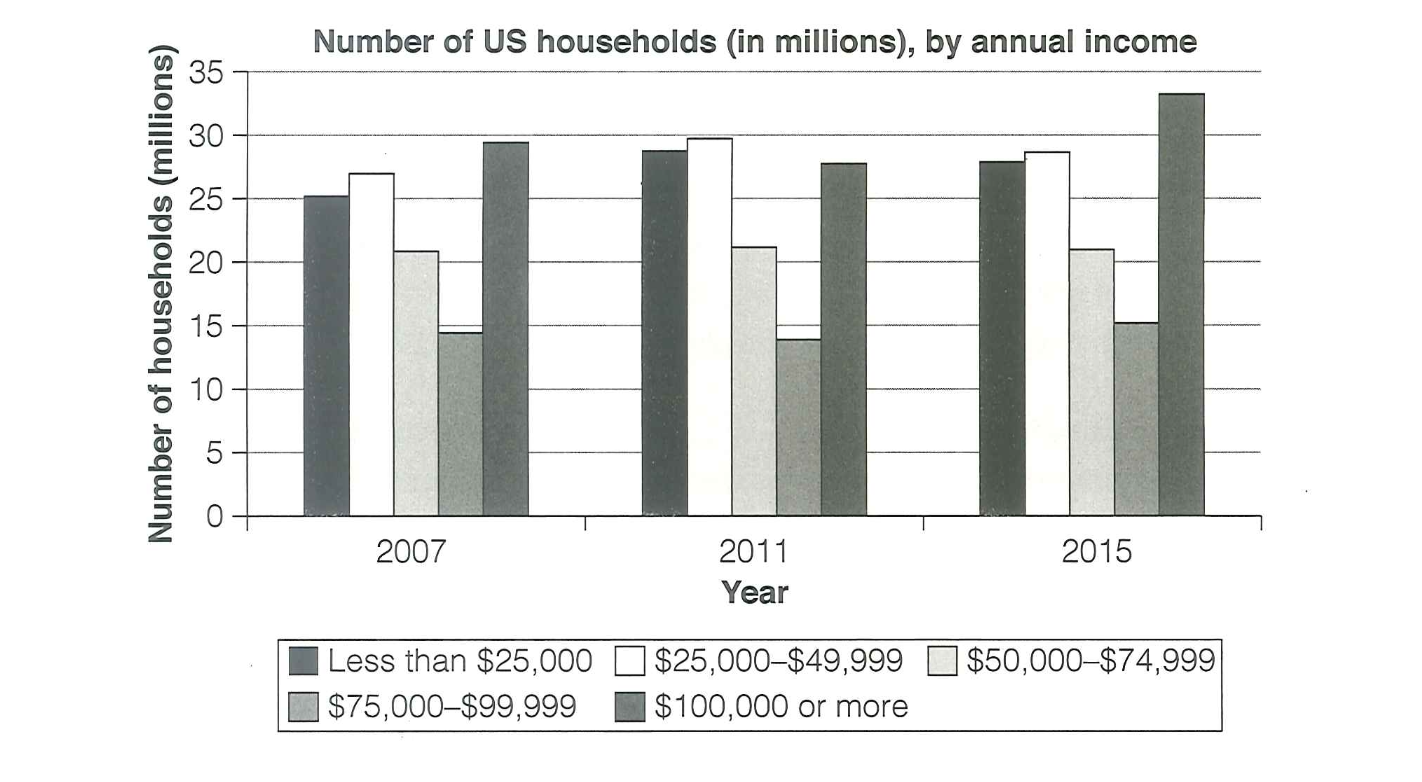
The chart below shows the number of households in the US by their annual income in 2007, 2011 and 2015. Summarize the information by selecting and reporting the main features, and make comparisons where relevant.
You should write a minimum of 150 words.
Source: Cambridge 18
Task answer
The bar chart provides information about the number of households in the US their yearly income in 2007,2011 and 2015.
Overall, the number of household in the US got the yearly income about 100,000 or more accounted for the majority. In the contrast, the total amount of households that earned about 50,000- 74,999 was remained stable.
The number of households in the US earned 75,000-99,999 was the lowest one with nearly 15 millions in 2007. Despite this, the amount of households got 100,000 or more received just under 30 millions in 2007. The group earned less than 25,000 and the group got 25,000-49,999 were around 25% in 2007.
The group got less than 25,000 and 25,000-49,999 stabilized at round from 27 millions to 30 millions in 2011 and 2015. The number of households that earned 50,000-74,000 remained stable at around 22% in 2011 and 2015. The amount of households got 100,000 or more had received 27 millions and then to a peak about 33 millions.
Word count:165