Writing report
academic IELTS Writing: Task 1
Overall score
6.50
6.5 of 9.0
Submitted on
Mar 03, 2025 (over 1 year ago)
Writing duration
0 minutes
Task description
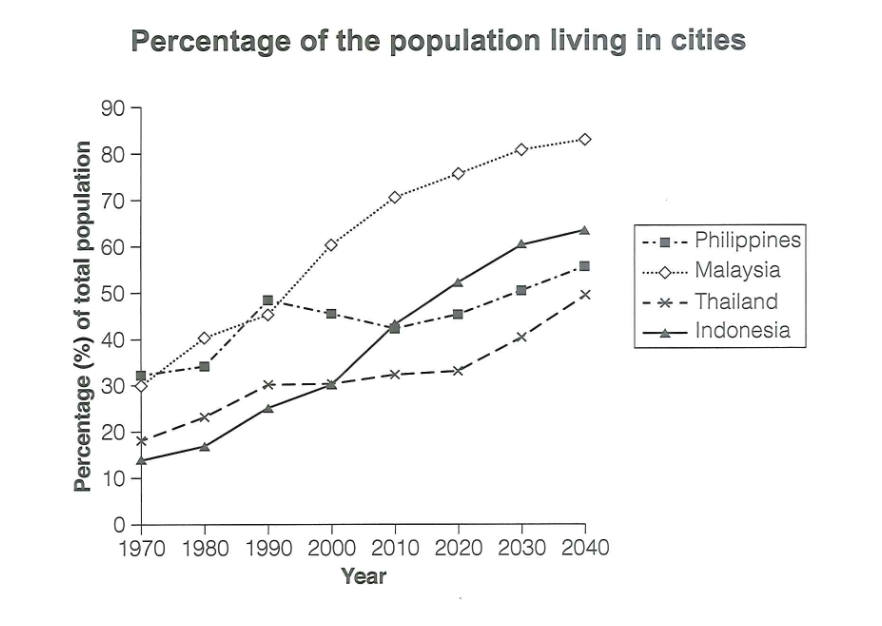
The graph below gives information about the percentage of the population in four Asian countries living in cities from 1970 to 2020, with predictions for 2030 and 2040. Summarize the information by selecting and reporting the main features, and make comparisons where relevant.
You should write a minimum of 150 words.
Source: Cambridge 18
Task answer
The line chart illustrates the percentage of people living cities in four different countries in Asia from the year 1970 to 2025, with predictions for 2030 and 2040.
Overall, almost every countries tended to increase except for Philippines, decreasing between 1990 to 2010. Philippines had the highest population in 1970, while Indonesia had the lowest percentage. However, in 2020, Malaysia had the highest ratio of population, while Thailand had the lowest.
Regarding Malaysia, the country had 30% of total population in 1970. It started to increase significantly to about 80% in 2020. It is predicted that in 2040 the country will have almost 90% of the people living in cities. Meanwhile, Philippines accounted for 30% of the population in 1970 and started to fluctuate only after 1990s. The country is predicted to have 60% of population in 2040.
On the other hand, Thailand's population took up almost 20% in 1970. The country started to fluctuate mildly and predicted to have 50% in 2040. Moreover, Indonesia started at over 10% in 1970. It started to increase gradually, surpassing Thailand at about 30% in 2000 and Philippines at over 40% in 2010. The Asian country is predicted to reach over 60% in 2040.
Word count:198