Writing report
academic IELTS Writing: Task 1
Overall score
7.00
7.0 of 9.0
Submitted on
Mar 06, 2025 (over 1 year ago)
Writing duration
369 minutes
Task description
The diagrams below give information on transport and car use in Edmonton. Summarise the information by selecting and reporting the main features, and make comparisons where relevant. Write at least 150 words.
You should write a minimum of 150 words.
Task answer
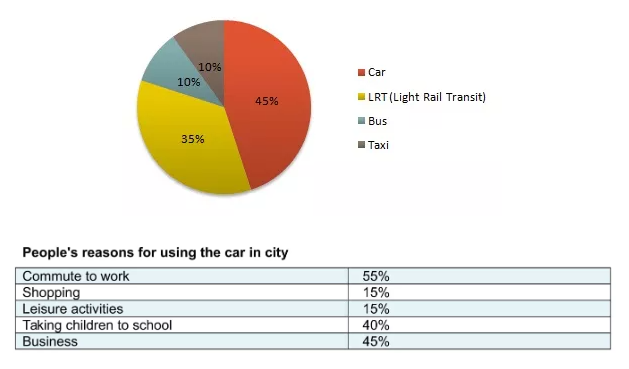
The given diagrams show the proportion of public transport used by people who live in Edmonton. The pie chart illustrates the proportion of transportation including cars, LRT, buses and taxies, while the table shows the percentage of commuters's reasons for using cars in the city.
Looking at the pie chart, it is easily apparent that cars play the most important part in the transportation system, by 45%. Besides, the percentage of LRT (Light Rail Transit) is at the second position on the plate. Buses and taxies hold the lowest figure with only 10%, indicating that the number of commuters using this transport is very low.
Commuting to work accounted the highest proportion for the reason people using cars in city with over the haft in all data table, by 55%. There is only 10% of people using cars for shopping and leisure activities. People is also use cars for their business so the percentage of this reason is just lower than the highest one.
Word count:162