Writing report
academic IELTS Writing: Task 1
Overall score
7.00
7.0 of 9.0
Submitted on
Mar 07, 2025 (over 1 year ago)
Writing duration
0 minutes
Task description
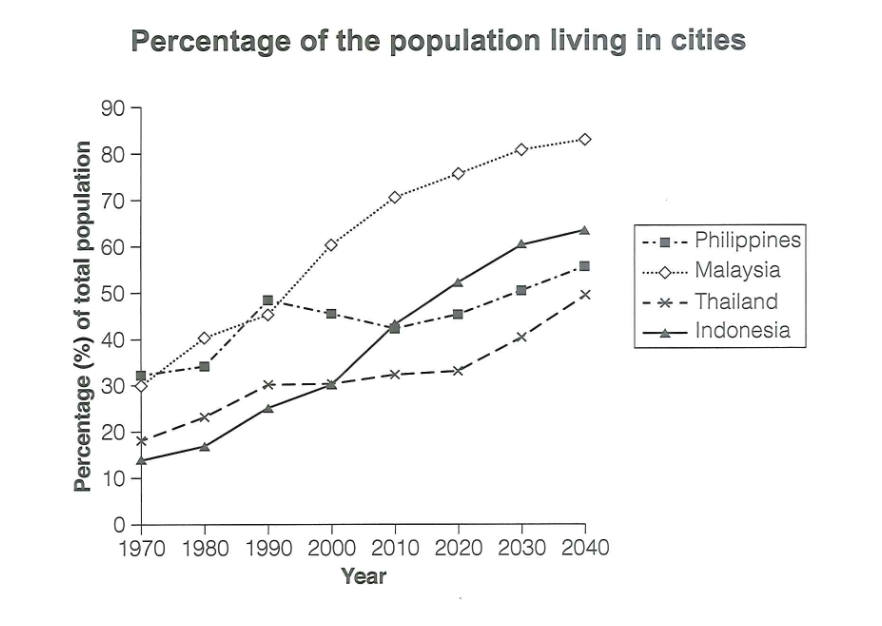
The graph below gives information about the percentage of the population in four Asian countries living in cities from 1970 to 2020, with predictions for 2030 and 2040. Summarize the information by selecting and reporting the main features, and make comparisons where relevant.
You should write a minimum of 150 words.
Source: Cambridge 18
Task answer
The graph indicates the proportion of the urban population in four Asian countries from the past, and projection for the future
From an overall perspective, it is clear that the percentage of the urban citizens in all nations generally increased. Among them, that of Malaysia took the lead and is expected to still have the highest urbanization rate. Meanwhile, the data of Indonesia and Thailand experienced a steady growth, and the figure for Indonesia is anticipated to overtake that of the Philippines in the future
In 1970, Malaysia had 30% of its urban population, and then significantly rose over 10% in 1990, and continued to surge and hold the highest position by 2040 with 80%. While the data of the Philippines experienced fluctuations after the 1990s, with a drop at 40% in 2010, then sharply grew, and is expected to reach the peak at 50% by 2040
In 1970, the urbanization rate of Indonesia was the last with over 10%, and gradually grew to nearly 30%, which was equal to that of Thailand in 2000 before being predicted to surpass Thailand and the Philippines in the last of the period with 60%. Although that, the figure for Thailand was more 5% than Indonesia in 1970, then continued to experience a slower growth to 30% in 1990, and remained unchanged to 2020, prior to being projected to increase and lagging behind with just under 50%
Word count:231