Writing report
academic IELTS Writing: Task 1
Overall score
6.50
6.5 of 9.0
Submitted on
Mar 14, 2025 (over 1 year ago)
Writing duration
0 minutes
Task description
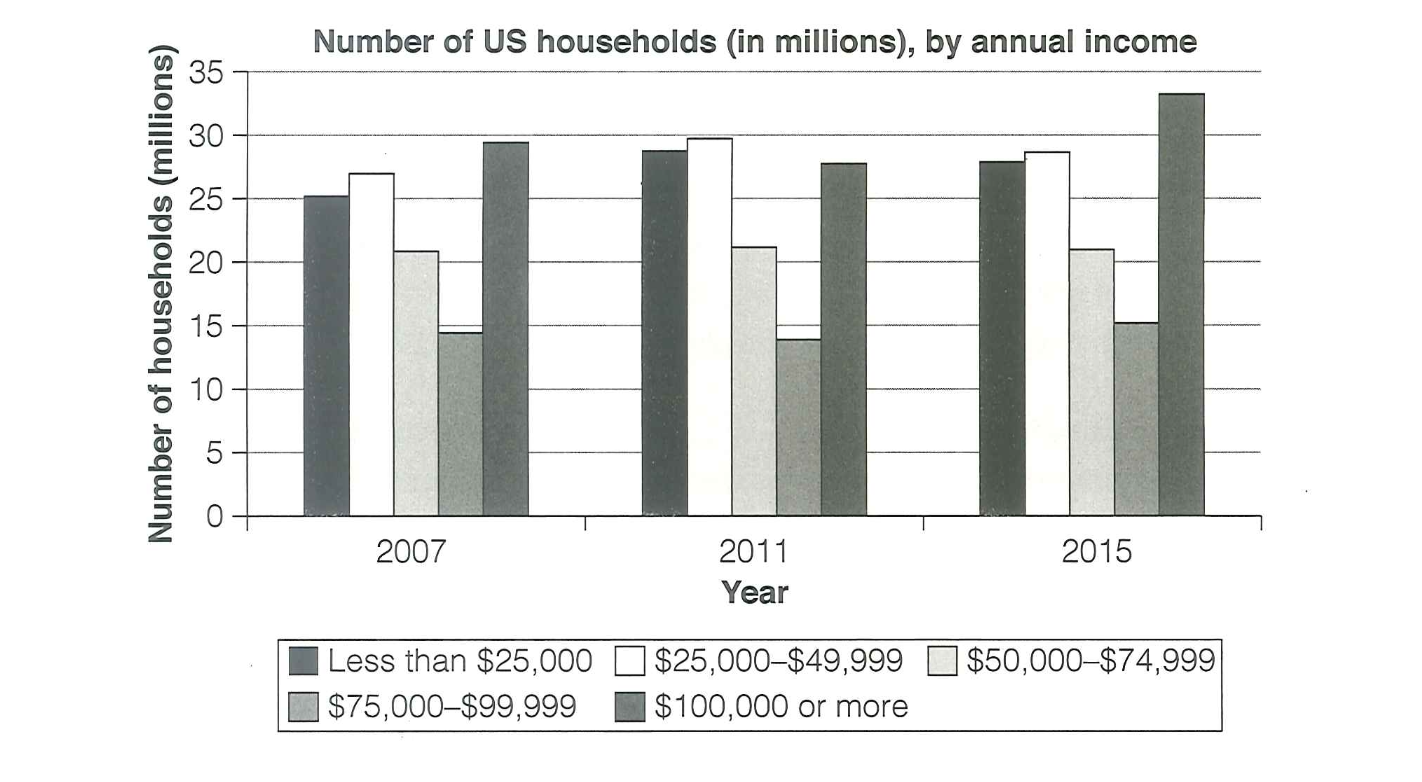
The chart below shows the number of households in the US by their annual income in 2007, 2011 and 2015. Summarize the information by selecting and reporting the main features, and make comparisons where relevant.
You should write a minimum of 150 words.
Source: Cambridge 18
Task answer
the bar chart illustrate the number of households in the us by their income in 2007, 2011 and 2015.
overall the number of households increase significantly after years. especially the households with 100.000 dollars incomes or more. while the households in the "75.000-99.999 dollars" segment remain stable.
in 2007 a considerable disparity can be seen between the households in the "75.000-99.999 dollars" segment and the 100,000 dollars or more segment. as we can see, the number of households with 100.000 or more income reach the highest place in 2007
Between 2011 and 2015, there were a few noticeable changes in the distribution of households across different income brackets. Specifically, households within the low to middle-income bracket showed a tendency to decrease slightly over the period. On the other hand, there was a significant leap in the number of high-income households, which saw considerable growth during the same period. This stark contrast between the two income segments highlights the increasing wealth disparity between different social classes, and it's something that could have long-term social and economic consequences.
Word count:175