Writing report
academic IELTS Writing: Task 1
Overall score
6.50
6.5 of 9.0
Submitted on
Mar 17, 2025 (over 1 year ago)
Writing duration
0 minutes
Task description
The charts below show the changes in ownership of electrical appliances and amount of time spent doing housework in households in one country between 1920 and 2019. Summarize the information by selecting and reporting the main features, and make comparisons where relevant,
You should write a minimum of 150 words.
Source: Cambridge 16
Task answer
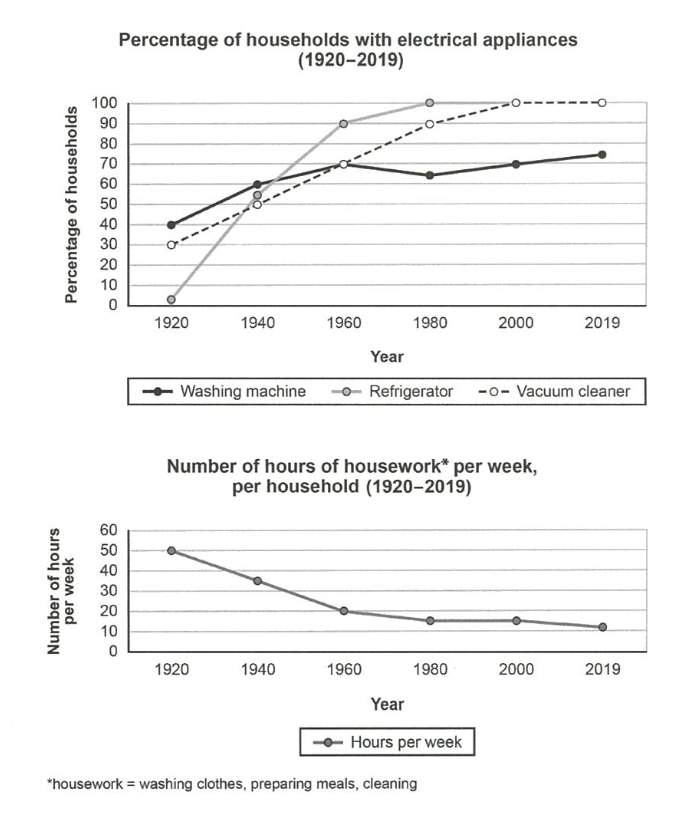
The line chart illustrates the alters in the electrical appliances ownership and how much time consumed on doing house tasks from 1920 to 2019.
Overall, washing machine, refrigerator and vacuum cleaner witnessed a rise in the numbers of ownership. Additionally, people had an tendency to own washing machine more than the two mentioned appliances in the earlier period, however, in the latter era, refrigerators was the item that almost all household had.
To begin with, in 1920, the washing machine boasted the highest percentage of ownerships, at 40%, followed by vaccum cleaner with 30%, meanwhile, the refrigerators had a neligible figure for ownership. In the following 4 decades, however, the refigerators experienced an exponential surge to 90% in ownerships, which showed an evidence that this item was necessary for almost households. The two mentioned appliances were still bought by the public but with a slower rate compared to the refrigerators, eventually, the proportions of these two appliances were similar, at 70%. In the next two decades, the refrigerators was still the item that people utilized most and ended up becoming the appliance that every household needed in the latter period. Moreover, the number of vacuum cleaner sold witnessed a moderate rise and also became the appliance that every household had in the following 4 decades. The percentage of washing machine ownership, nevertheless, remained stable until the end of the era, which was about 65% and 73%.
What is more, there were some changes in the number of house-working hours in the same period. At the beggining, people used to spend 50 hours on house chores per week, however, this number underwent an steady plunge to 20 hours in the next 4 decades. From 1960 to 2019, the time that consumed on housework per week gradually decreased to 10 hours.
Word count:297