Writing report
academic IELTS Writing: Task 1
Overall score
7.00
7.0 of 9.0
Submitted on
Mar 26, 2025 (over 1 year ago)
Writing duration
0 minutes
Task description
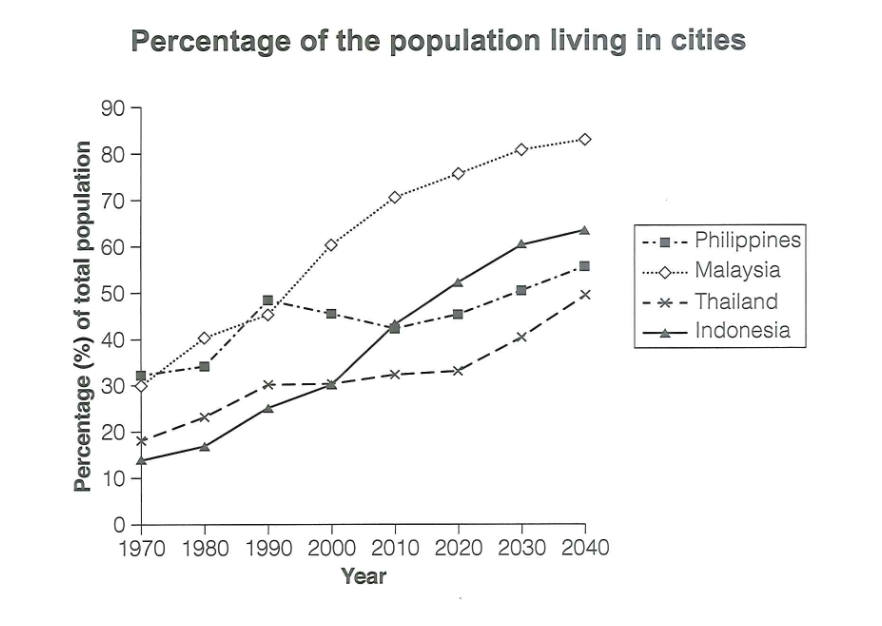
The graph below gives information about the percentage of the population in four Asian countries living in cities from 1970 to 2020, with predictions for 2030 and 2040. Summarize the information by selecting and reporting the main features, and make comparisons where relevant.
You should write a minimum of 150 words.
Source: Cambridge 18
Task answer
The line graph illustrates the population in four different Asian countries living in urban areas percentage-wise between 1970 and 2020, followed by predictions for 2030 and 2040.
Overall, there was an increase in the proportion of people living in cities from four different countries, with Malaysia witnessing the most dramatic rise to become the most common rate. In addition, the figure for Indonesia increased to surpass that of Thailand and the Philippines, making it the second most highest percentage throughout the period.
In 1970, The figure for Malaysia started at exactly 30%, after which it experienced a dramatic growth to approximately 74% after 50 years, it was then estimated to reach exactly 80% in 2040. Similar changes, but to a lesser extent can be seen in the figure for the Philippines, which started at about 31%, followed by a significant rise to nearly one-half of the country's population after 20 years before dropping to around 45% in 2020, with predictions to reach at 60% by the end of 2040.
Specifically, around 12% and 19% were started in 1970 for Indonesia and Thailand, respectively, with a subsequent considerable increase to 30% and one-half in 2020. These figures are then expected to end at approximately 45% and 60% by end of the period.
Word count:208