Writing report
academic IELTS Writing: Task 1
Overall score
7.00
7.0 of 9.0
Submitted on
May 11, 2025 (about 1 year ago)
Writing duration
0 minutes
Task description
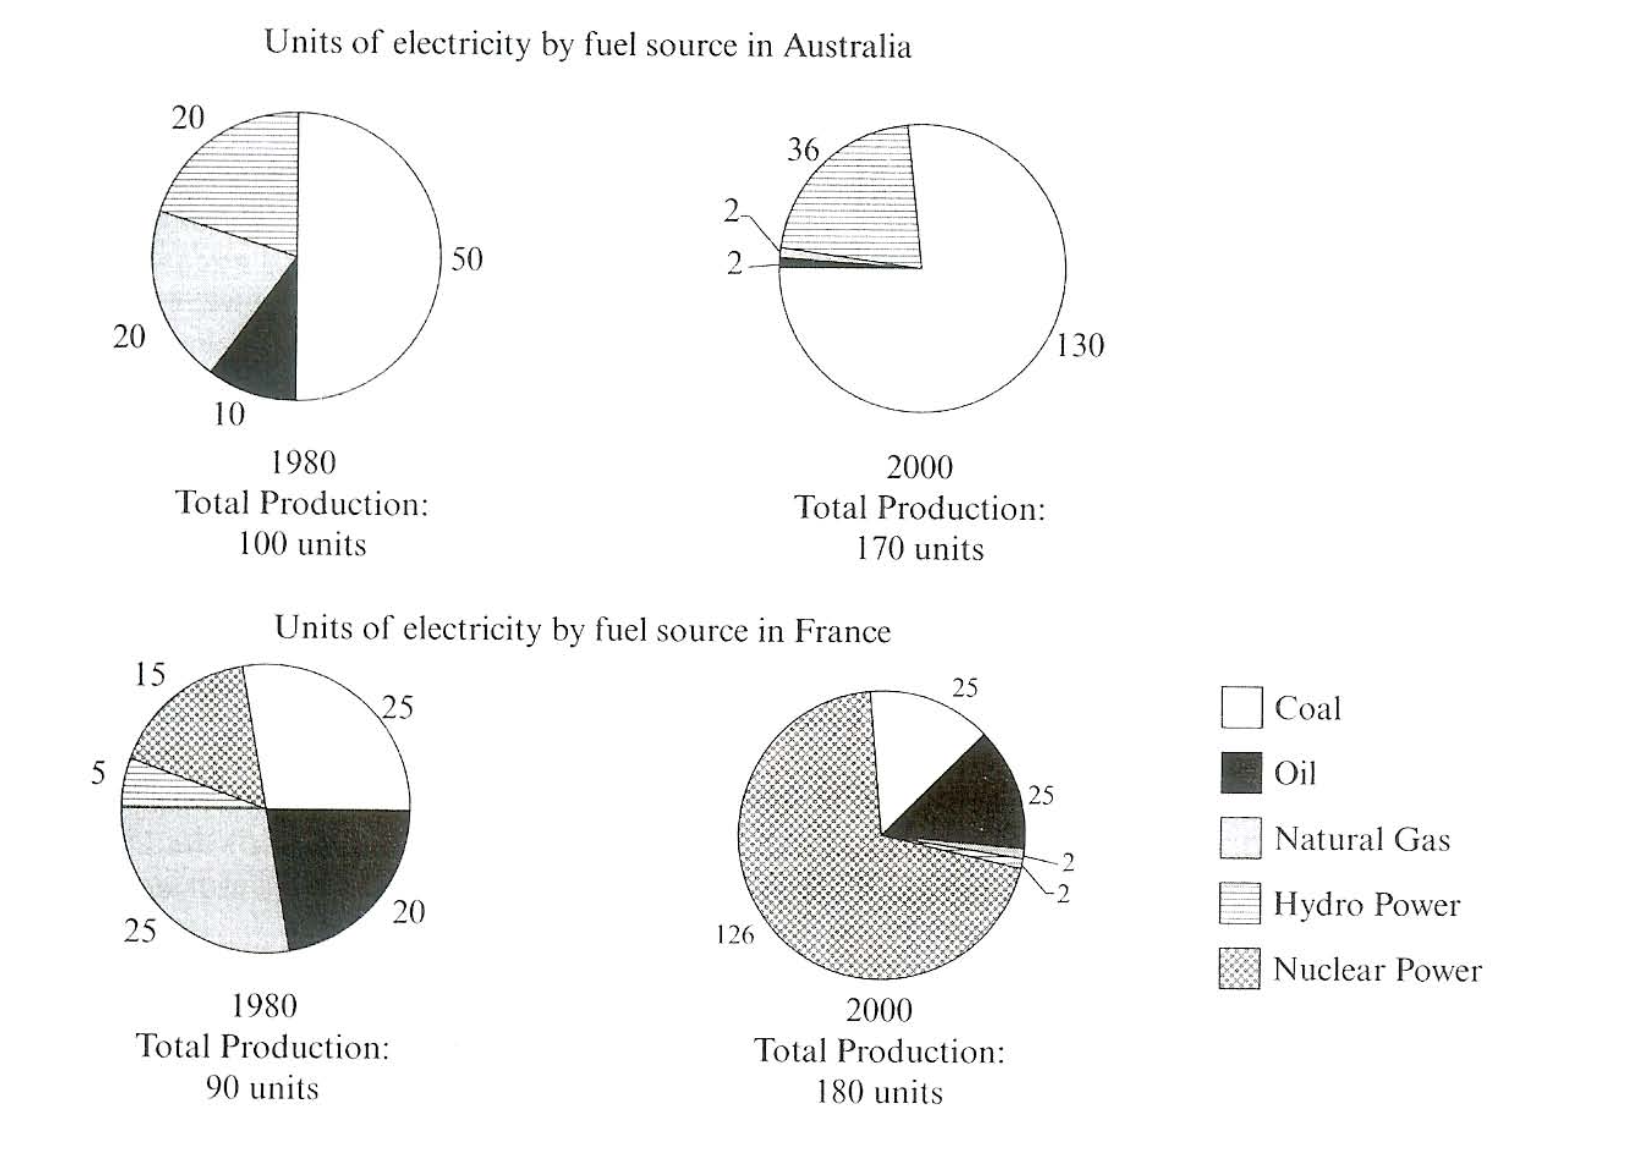
The pie charts below show units of electricity production by fuel source in Australia and France in 1980 and 2000. Summarize the information by selecting and reporting he main features ad make comparisons where relevant.
You should write a minimum of 150 words.
Source: Cambridge 7
Task answer
The figures illustrate the amount of electric power generated by different materials in Australia and France in 1980 and 2000.
Overall, there are four fuel sources in Australia and five in France, which remained constant in 20 years, and the energy output rose almost twice in both areas. However, the percentage of each source's contribution to the electricity produced changed significantly.
Concerning the indexes of Australia, the four materials used to generate energy are coal, oil, natural gas and hydro power. Coal was the most important supply for the industry, accounting for half the electricity produced in 1980 and increased to over 76% in 2000. The utilization of oil and natural gas dropped dramatically, from 10% and 20% respectively to 1.2% over the period of 20 years. Hydro power usage remained the same at approximately 20%.
Shifting the focus to the figures of France, out of the five fuel sources listed, four were the same as Australia's, only with the addition of nuclear power. The contributions of nuclear power witnessed a drastic increase of 53% in 20 years, from producing only 15 out of 90 units of electricity in 1980 to 126 units out of 180 in 2000. Uniquely, the amount of energy generated from coal remained the same (25 units) in both years recorded. Whereas the product count of oil utilization observed a very small decrease of 25%, the indexes of hydro power use and natural gas use were more significant, standing at 60% and 92%, respectively.
Word count:245