Writing report
academic IELTS Writing: Task 1
Overall score
7.00
7.0 of 9.0
Submitted on
May 12, 2025 (about 1 year ago)
Writing duration
0 minutes
Task description
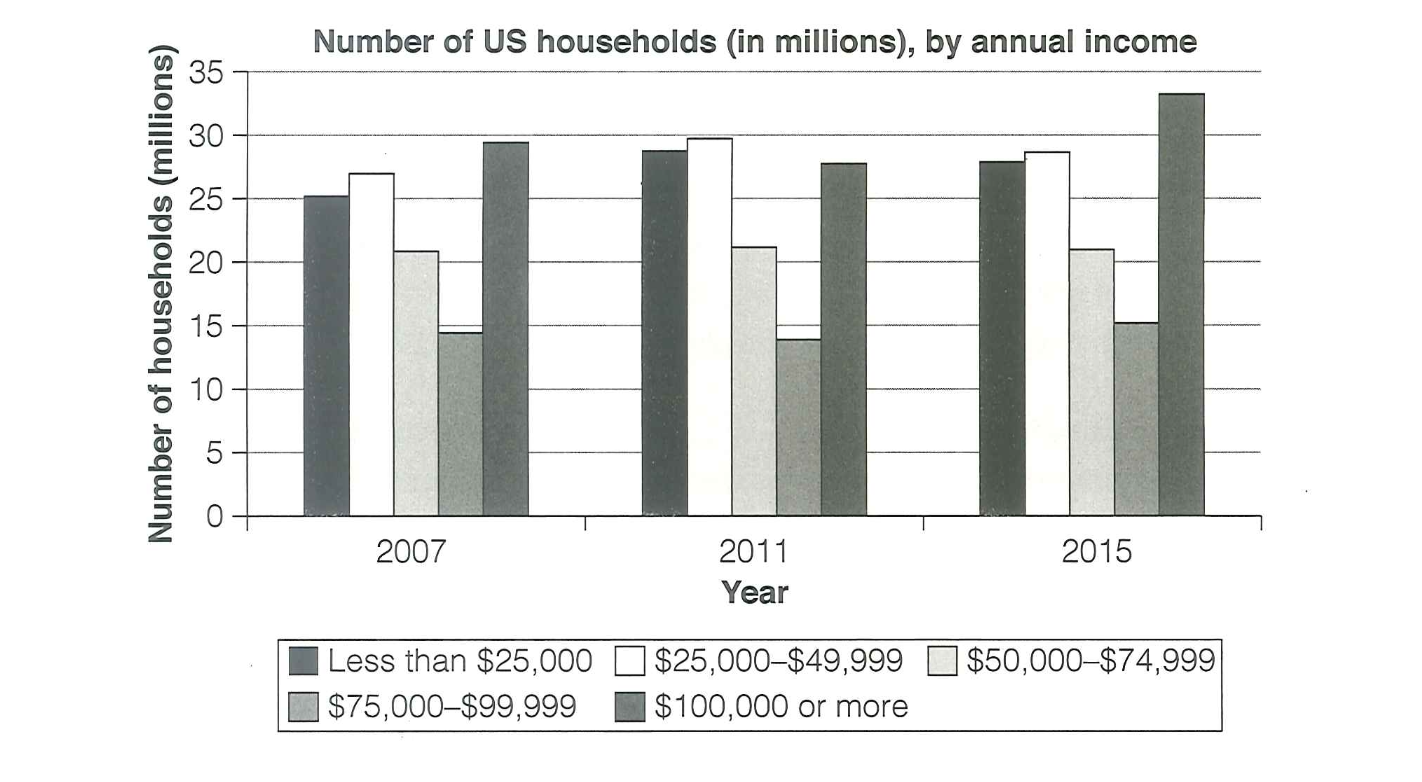
The chart below shows the number of households in the US by their annual income in 2007, 2011 and 2015. Summarize the information by selecting and reporting the main features, and make comparisons where relevant.
You should write a minimum of 150 words.
Source: Cambridge 18
Task answer
The bar chart illustrates how American households were distributed across five income brackets in the years 2007, 2011 and 2015.
Overall, while families earning less than $50,000 witnessed a surge followed by a slight drop, those with an income exceeding $75,000 saw a minor decrease before rebounding. Additionally, the number of households in the mid-income relatively remained stable over the period.
Regarding households whose yearly income fell below $25,000, the figure commenced at approximately 25 million in 2007. This count subsequently rose to about 29 million in 2011, before experiencing a modest decline of 1 million in 2015. Similarly, for families earning between $25,000 and $49,999, their numbers were around 26 million in 2007, which grew to nearly 30 million in 2011, and eventually dropped to approximately 28 million in 2015.
Concerning families with high annual incomes, specifically within the range of $75,000 to $99,999 and $100,000 or more, exhibited a downward trajectory in 2011, but a reversal of this trend was observed in 2015, with numbers on the rise. Interestingly, families falling within the mid-income bracket displayed a plateau, with their count remaining consistent across the three years.
Word count:186