Writing report
academic IELTS Writing: Task 1
Overall score
6.50
6.5 of 9.0
Submitted on
May 18, 2025 (about 1 year ago)
Writing duration
0 minutes
Task description
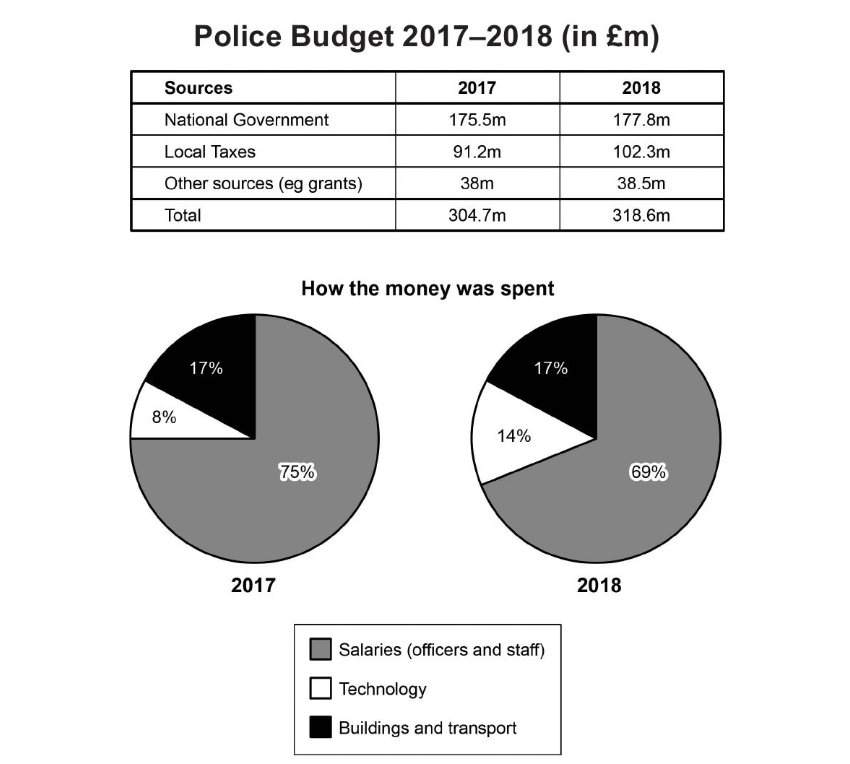
The table and charts below give information on the police budget for 2017 and 2018 in one area of Britain. The table shows where the money came from and the charts show how it was distributed. Summarize the information by selecting and reporting the main features, and make comparisons where relevant.
You should write a minimum of 150 words.
Source: Cambridge 17
Task answer
the table proves information about the amounts of money funded for police force in an arena in the UK from three primary sources in 2017 and 2018. Additionally, the pie chart give data about the percentages of entire spending of this police force in three distinctive sectors.
Overall, the amounts of funding from all these three sources had increased to various extent. Furthermore, while spending on salaries occupied a smaller proportion in 2018, expenditure on technologies had received a larger percentage of the budget allocation.
Regarding to the table, the national government was responsible for the largest amount of funding, increasing from 175.5 to 177.8 million pounds between these years. Although the amount of money collected from the local taxes had remained smaller, it had observed the most significant increase, from only 91.2 to more than 100 million pounds after only one year. Other sources with the inclusion of grants provided a stable amount of funding, slightly inclining from 38 to 38.5 millions pounds. These increases had expanded the total budget of the police from 304.7 to 318.6 millions pounds
The pie chart also witnesses notable changes regarding the budget allocation of this police force. Although paying salaries still consumed the most sources in two years. There had been a small declined in its proportion from 75% to 69%. This plunge had allowed the police to increase their spending on technologies, initially comprising only 8%on 2017 but up to 14% in 2018. The amount of money used for buildings and transport had remained unchanged at 17%.
Word count:254