Writing report
academic IELTS Writing: Task 1
Overall score
7.00
7.0 of 9.0
Submitted on
May 19, 2025 (about 1 year ago)
Writing duration
0 minutes
Task description
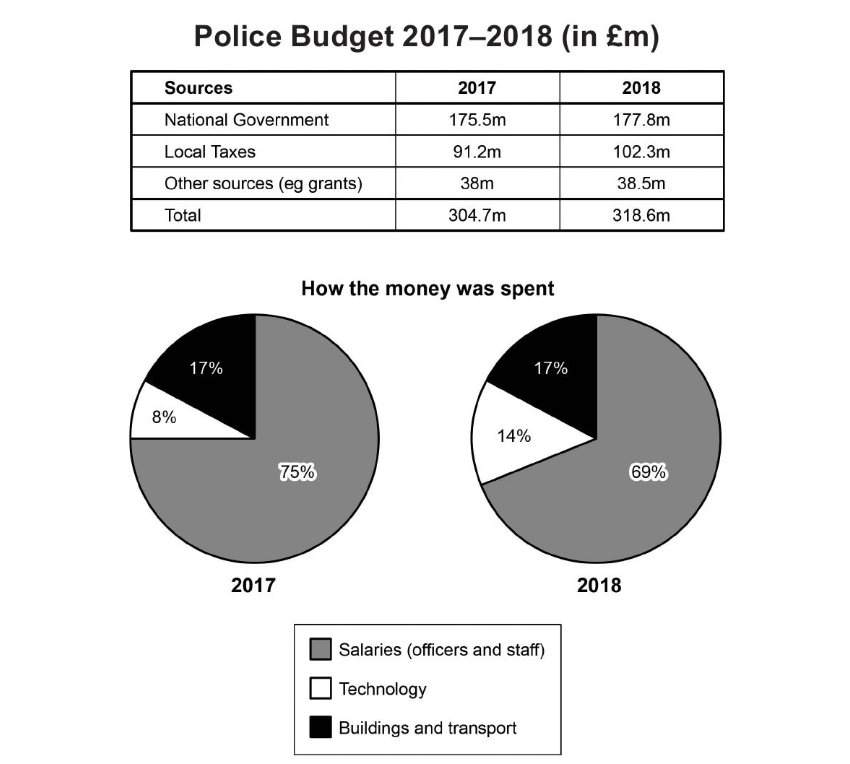
The table and charts below give information on the police budget for 2017 and 2018 in one area of Britain. The table shows where the money came from and the charts show how it was distributed. Summarize the information by selecting and reporting the main features, and make comparisons where relevant.
You should write a minimum of 150 words.
Source: Cambridge 17
Task answer
The figures illustrate the sources of fundings in millions of pounds allocated to the law enforcers in 2017 and 2018, and what the money was used on.
Overall, the amount of money given to the police went up in 2018. The spending categories stayed constant, although the relative amount used on each one experienced slight changes.
The table clearly shows that there were no fluctuations in the sources of the budget for the officers, yet the measure increased by 13.9 million pounds in one year. The majority of this was attributed to the rise in local taxes of 9.1 million pounds, accounting for two thirds of the increment. The rest came from a higher national government fund (from 175.5 to 177.8 million pounds) and other grants (from 38 to 28.5 million pounds).
Switching the focus on how the money was utilized, in both years recorded it was obvious that the three spending brackets remained the same: salaries, technology and buildings and transport. While the total allocated to the incomes of officers and staff witnessed a drop of 6%, the total for technology went up by the same amount. In contrast, the budget utilized for infrastructures and vehicles stayed unchanged at 17%.
Word count:198