Writing report
academic IELTS Writing: Task 1
Overall score
8.00
8.0 of 9.0
Submitted on
May 21, 2025 (about 1 year ago)
Writing duration
0 minutes
Task description
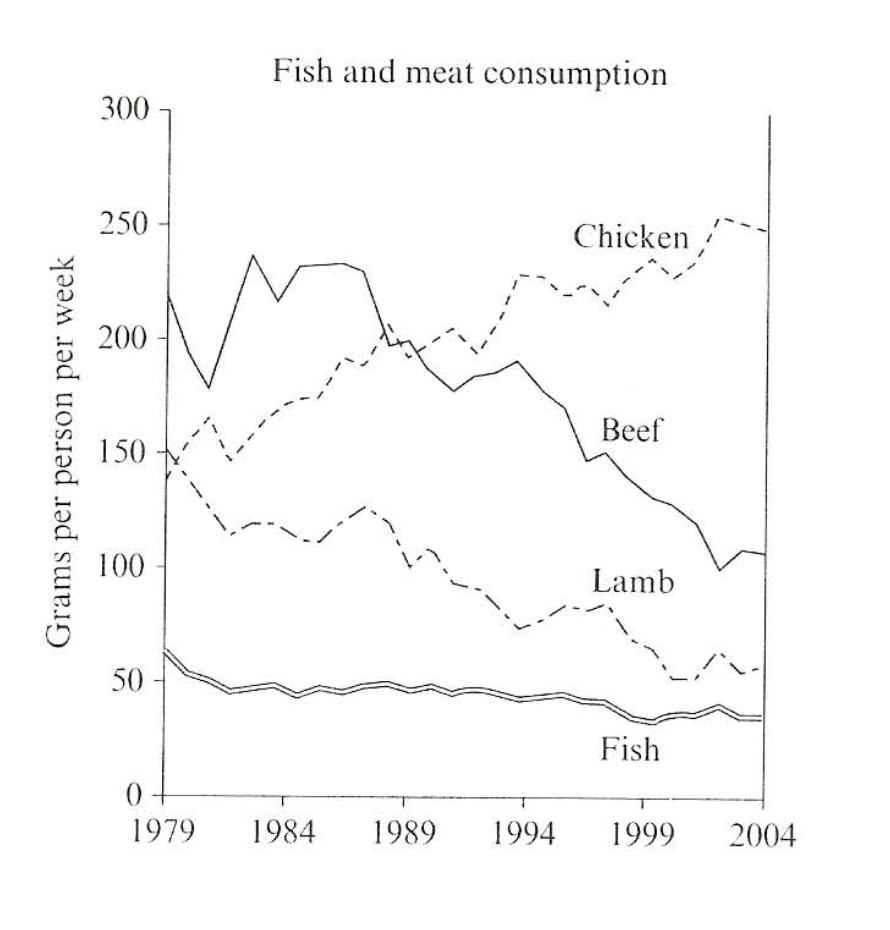
The graph below shows the consumption of fish and some different kinds of meat in a European country between 1979 and 2004. Summarize the information by selecting and reporting the main features and make comparisons where relevant.
You should write a minimum of 150 words.
Source: Cambridge 7
Task answer
The graph illustrates the amount of fish, beef, lamb, and chicken consumed in a nation in European from 1979 to 2004.
At first glance, chicken consumption increased significantly, while the consumption of meat-beef, lamb and fish showed a downward trend throughout the period.
In 1979, beef consumption started at around 200 grams per person per week. This figure then rose to a peak of approximately 240 grams in 1993 before falling by more than half to roughly 110 grams per person in 2004. Similarly, lamb consumption declined significantly from 150 grams in 1979 to below 70 grams in 2004.
The quantity of chicken consumed stood at around 140 grams per person per week in 1979. This figure increased sharply, surpassing that of beef in 1989 and becoming the most consumed meat type by 2004. By contrast, the amount of fish consumed saw a slight decline of 20 grams, from roughly 60 grams to 40 grams between 1979 and 2004.
Word count:158