Writing report
academic IELTS Writing: Task 1
Overall score
7.00
7.0 of 9.0
Submitted on
May 22, 2025 (about 1 year ago)
Writing duration
0 minutes
Task description
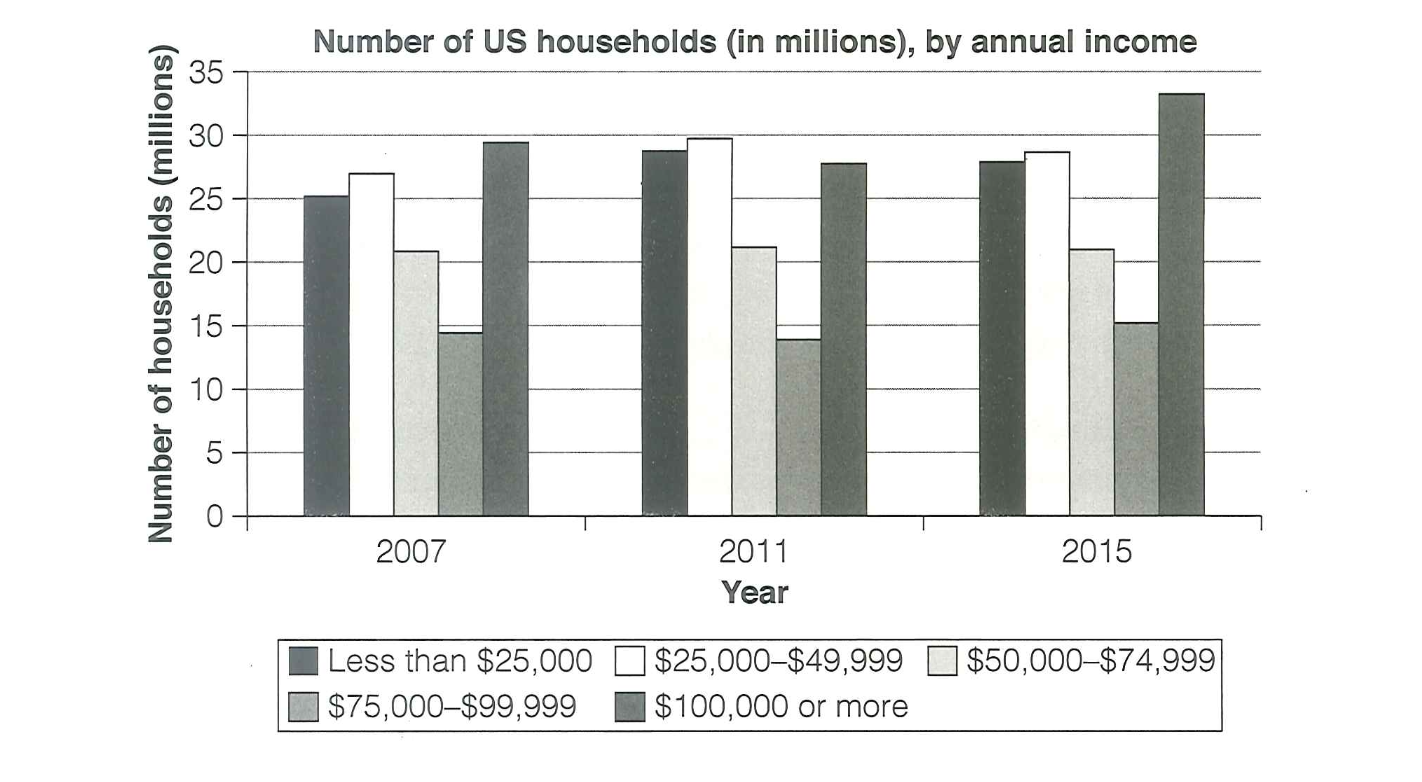
The chart below shows the number of households in the US by their annual income in 2007, 2011 and 2015. Summarize the information by selecting and reporting the main features, and make comparisons where relevant.
You should write a minimum of 150 words.
Source: Cambridge 18
Task answer
The given bar chart illustrates the number of US households based on their income yearly in three separate years 2007, 2011 and 2015.
Overall, it is noticeable that the figure for households with the $75,000-$99,999 income experienced the lowest while the group $100,000 reached its peak over the whole the period. Besides, the 3 other groups showed a slightly change in their figure.
In 2007, the number of US households with less than $25,000 began at 25 millions. This figure witnessed a substantial increase to 29 millions in 2011, then decreased by 2 millions in 2015. Additionally, the $25,000-$49,999 group saw a rise by approximately 1 millions, compared with the former group, over the period. Moreover, the figure for $50,000-$74,999 group stayed stable during three years of research, with nearly 21 millions of households.
In terms of households with annual income stood at $75,000-$99,999, there was a slightly decrease from just under 15 millions to 14 millions in 2007 and 2011, then recovered to exactly 15 millions in 2015. Furthermore, the figure for more than $100,000 groups was doubled to $75,000-$99,999 group in the same year of research and peaked at around 34 millions in 2015.
Word count:193