Writing report
academic IELTS Writing: Task 1
Overall score
6.00
6.0 of 9.0
Submitted on
May 27, 2025 (about 1 year ago)
Writing duration
0 minutes
Task description
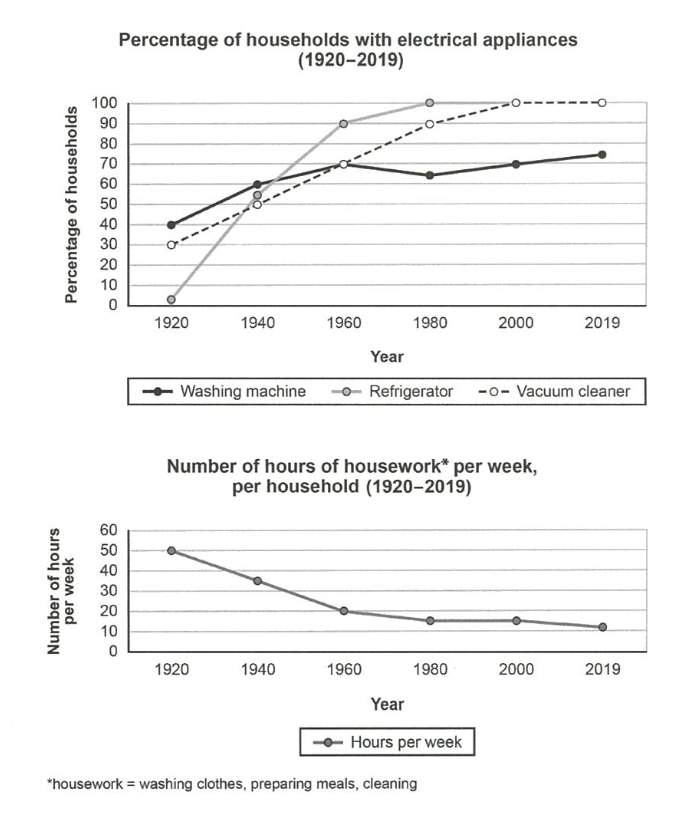
The charts below show the changes in ownership of electrical appliances and amount of time spent doing housework in households in one country between 1920 and 2019. Summarize the information by selecting and reporting the main features, and make comparisons where relevant,
You should write a minimum of 150 words.
Source: Cambridge 16
Task answer
The first line graph compares the variation in the percentage of households consuming three electrical appliance and he second chart illustrates the amount of time, in hours, spent doing housework from 1920 to 2019.
Looking at the first chart, it is clear that there is an increasing trend in the number of families using electrical appliances with refrigerator consumption dominating over the period shown. In constrast, the other line graph witnessed a significant decrease in a row during the same duration.
In detail, in the two first years, the percentage of homes with refrigerator stood at zero and then escalated to over 55% which is slightly more than vacuum cleaner ( 50%) but less than washing machine (60%). From then on, three electrical devices used by households rose gradually over each year, but washing machine was around 30% less than the two others (100%) in the two last years.
In 1920, each household handled the housechores 50 hours per week. That figure afterwards fell by 2.5 times over 41 years since then. However, there was of marginal decrease ( 20% to 10%) in the hours they did housework from 1960 onwards, especially the same amount ( 15%) in 1980 and 2000.
Word count:200