Writing report
academic IELTS Writing: Task 1
Overall score
6.00
6.0 of 9.0
Submitted on
Jun 02, 2025 (about 1 year ago)
Writing duration
0 minutes
Task description
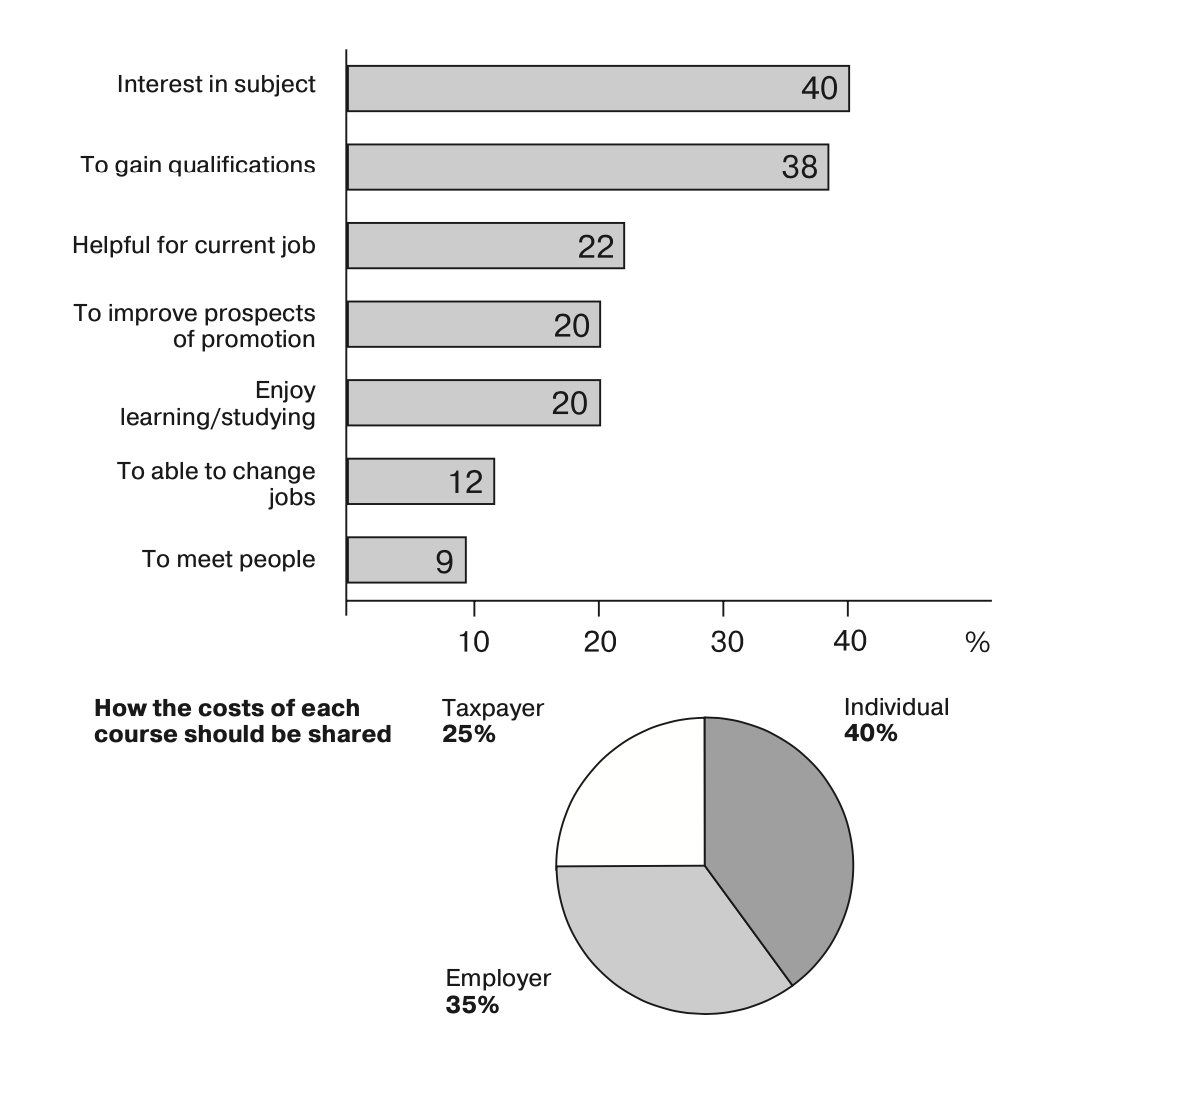
The charts below show the results of a survey of adult education. The first chart shows the reasons why adults decide to study. The pie chart shows how people think the costs of adult education should be shared. Write a report for a university lecturer, describing the information shown below.
You should write a minimum of 150 words.
Source: Cambridge 1
Task answer
The bar chart illustrate the reasons for studying among adults. The pie chart shows they way costs of adult education should be shared according to a survey.
Overall, the main reason people decide to study is due to interest and qualifications, while studying to meet more people isn't their purpose. As a result, they think the majority of costs of each course should be for learners. The units are measured in percentage.
As for the first chart, learning just what with hobby accounts and with a view to doing a degree for the largest percentage, at 40% and 38% respectively. On the other hand, changing jobs and meeting new people in fact doesn't appeal to many people, with 12% and 9% within the total. Regarding the other motives, support for current job, improvement of promotional prospects and enjoyment of learning, they are almost similar to one another, with 22% and 20%.
Above results also underpin for the share of costs. Individual makes up mainly, at 40%, nearly 2 times as much as taxpayer. Employer is in the middle of the average cost, with 35%.
Word count:182