Writing report
academic IELTS Writing: Task 1
Overall score
7.50
7.5 of 9.0
Submitted on
Jun 02, 2025 (about 1 year ago)
Writing duration
0 minutes
Task description
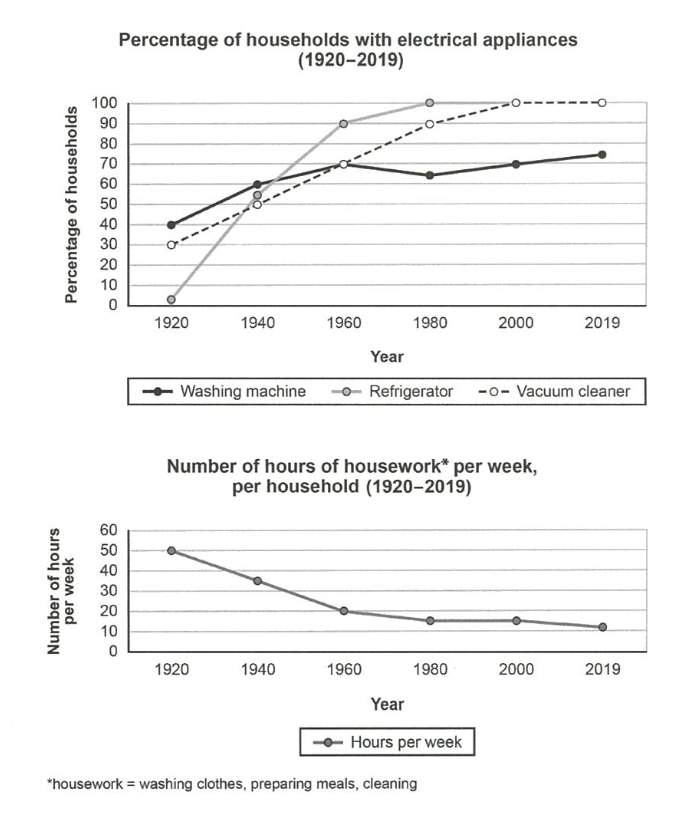
The charts below show the changes in ownership of electrical appliances and amount of time spent doing housework in households in one country between 1920 and 2019. Summarize the information by selecting and reporting the main features, and make comparisons where relevant,
You should write a minimum of 150 words.
Source: Cambridge 16
Task answer
The first line graph compares the proportion of households possessing electrical devices. The other graph depicts the trend of hours of doing housework per week in each house through nearly a century since 1920.
Overall, the houses with electronic appliances saw a continuous increase through the period shown, with the most remarkable seen in homes having refrigerators. Consquently, household chores were less done during the same period.
From 1920 to 1980, households with refrigerator peaked at 100% and remained stable until 2019, making it an unevitable appliance for every house. As for washing machine, it also underwent a slight growth from 40% to just over 70%. Furthermore, in 60 first years, vacuum cleaner rose steadily by average 20% in each 20-year period. Notably, it overtook washing machine to 100% in 2019.
Moving on to the second line graph, this trend shows a converse pattern to that in the first one. This as well as above data also reflected the decline in the number of hours doing housework was attributed to the advent of modern electrical devices. At 50 hours in 1920, this figure fell to approximately 10 in 1980, after which, it fluctuated around 10 until the end of term.
Word count:197