Writing report
academic IELTS Writing: Task 1
Overall score
7.50
7.5 of 9.0
Submitted on
Jun 13, 2025 (12 months ago)
Writing duration
0 minutes
Task description
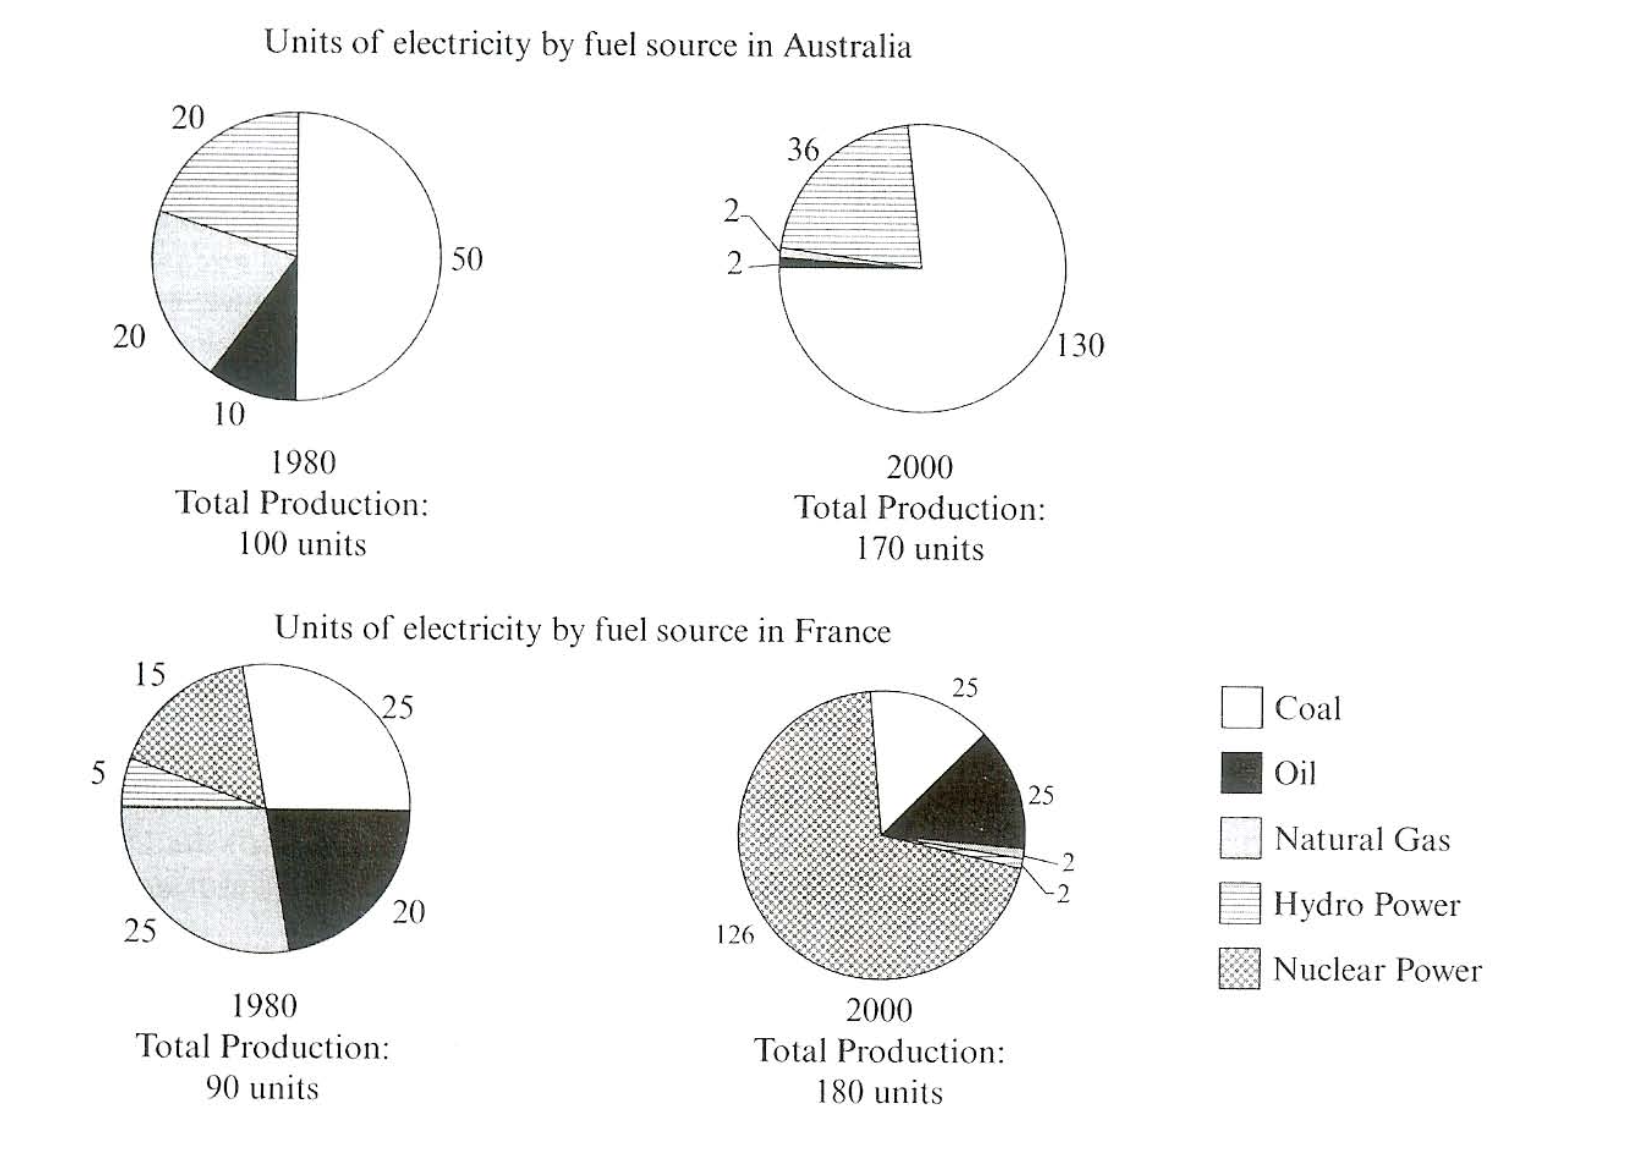
The pie charts below show units of electricity production by fuel source in Australia and France in 1980 and 2000. Summarize the information by selecting and reporting he main features ad make comparisons where relevant.
You should write a minimum of 150 words.
Source: Cambridge 7
Task answer
The pie chart compares the units of electricity produced by various fuel sources in Australia and France from 1980 to 2000.
Overall, while more electricity has been produced by coal and hydro power during the time given in Australia, natural gas and oil was less popular for manufacturing electricty. Similarly, the units of electricity produced by oil and nuclear power have the upward trends, in contrast to that of natural gas and hydro power, which both experienced the downward trends in France. Moreover, the amount of coal used for making electricity in France stabilized during the timeframe.
In Australia, coal was most favoured to produce electricity, which had the highest numbers of electricity production in the year 1980 (50 units) and 2000 (130 units,). Both hydro power and natural gas generated the similar units of electricity (20 units) in 1980; however; when the figure for the former increased significantly to 36 units in 2000, the figure for the latter recorded a notable decrease to only 2 units .
In France, the production of nuclear power to make electricity only acounted for 15 units in 1980 before rocketing to 126 units in the next 20-year period, followed by oil, which rose to 25 units in 2000, whilst natural gas and hydro power saw a decline of 23 and 3 units, respectively. Eventually, the period from 1980 and 2000 saw a stabilization of electricity production by coal.
Word count:234