Writing report
academic IELTS Writing: Task 1
Overall score
7.50
7.5 of 9.0
Submitted on
Jun 18, 2025 (12 months ago)
Writing duration
0 minutes
Task description
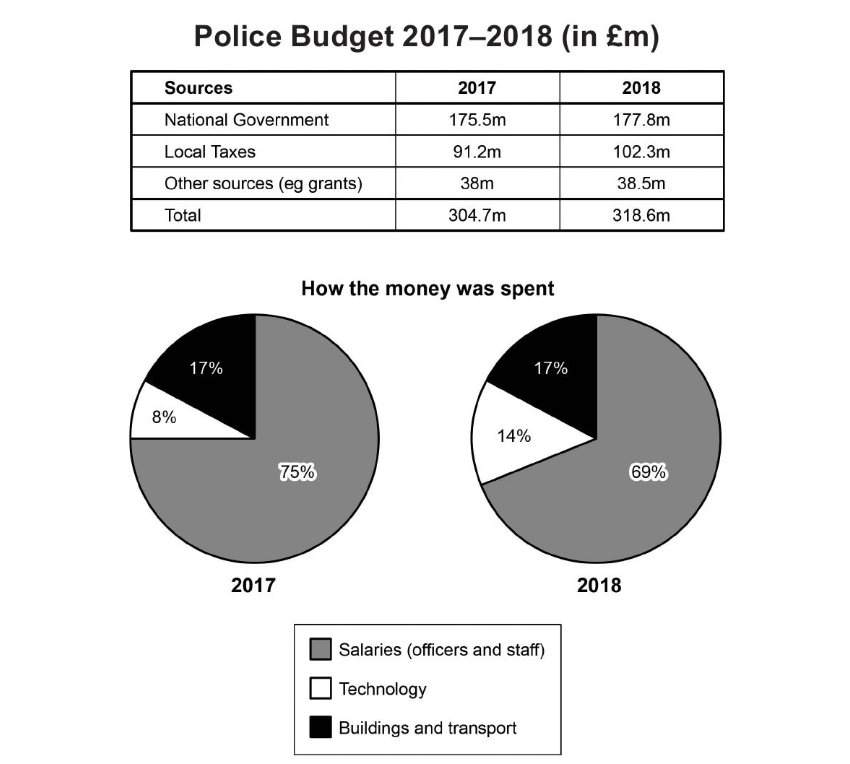
The table and charts below give information on the police budget for 2017 and 2018 in one area of Britain. The table shows where the money came from and the charts show how it was distributed. Summarize the information by selecting and reporting the main features, and make comparisons where relevant.
You should write a minimum of 150 words.
Source: Cambridge 17
Task answer
The table and the pie charts illustrate the police budget in one area of Britain in 2017 and 2018. The table shows the sources of income, while the charts display how the funds was allocated.
Overall, the total police budget increased slightly in 2018, with national government remaining the contributor. Most of the funding was spent in salaries, although this proportion declined slightly.
In 2017, the total budget stood at £304.7 million, rising to £318.6 million in 2018. The majority came from the national government ( £175.5 million in 2017 to £177.8 million in 2018), followed by local taxes, which rose significantly from £91.2 million to £102.3 million. Other sources, such as grants, remained nearly unchanged around £38 million.
Salaries account for the largest portion of spending in both years, though it decreased from 75% in 2017 to 69% to 2018. Spending in technology almost doubled, rising from 8% to 14%, while the proportion allocated to buildings and transport remained constant at 17%
Word count:161