Writing report
academic IELTS Writing: Task 1
Overall score
7.50
7.5 of 9.0
Submitted on
Jun 19, 2025 (about 1 year ago)
Writing duration
0 minutes
Task description
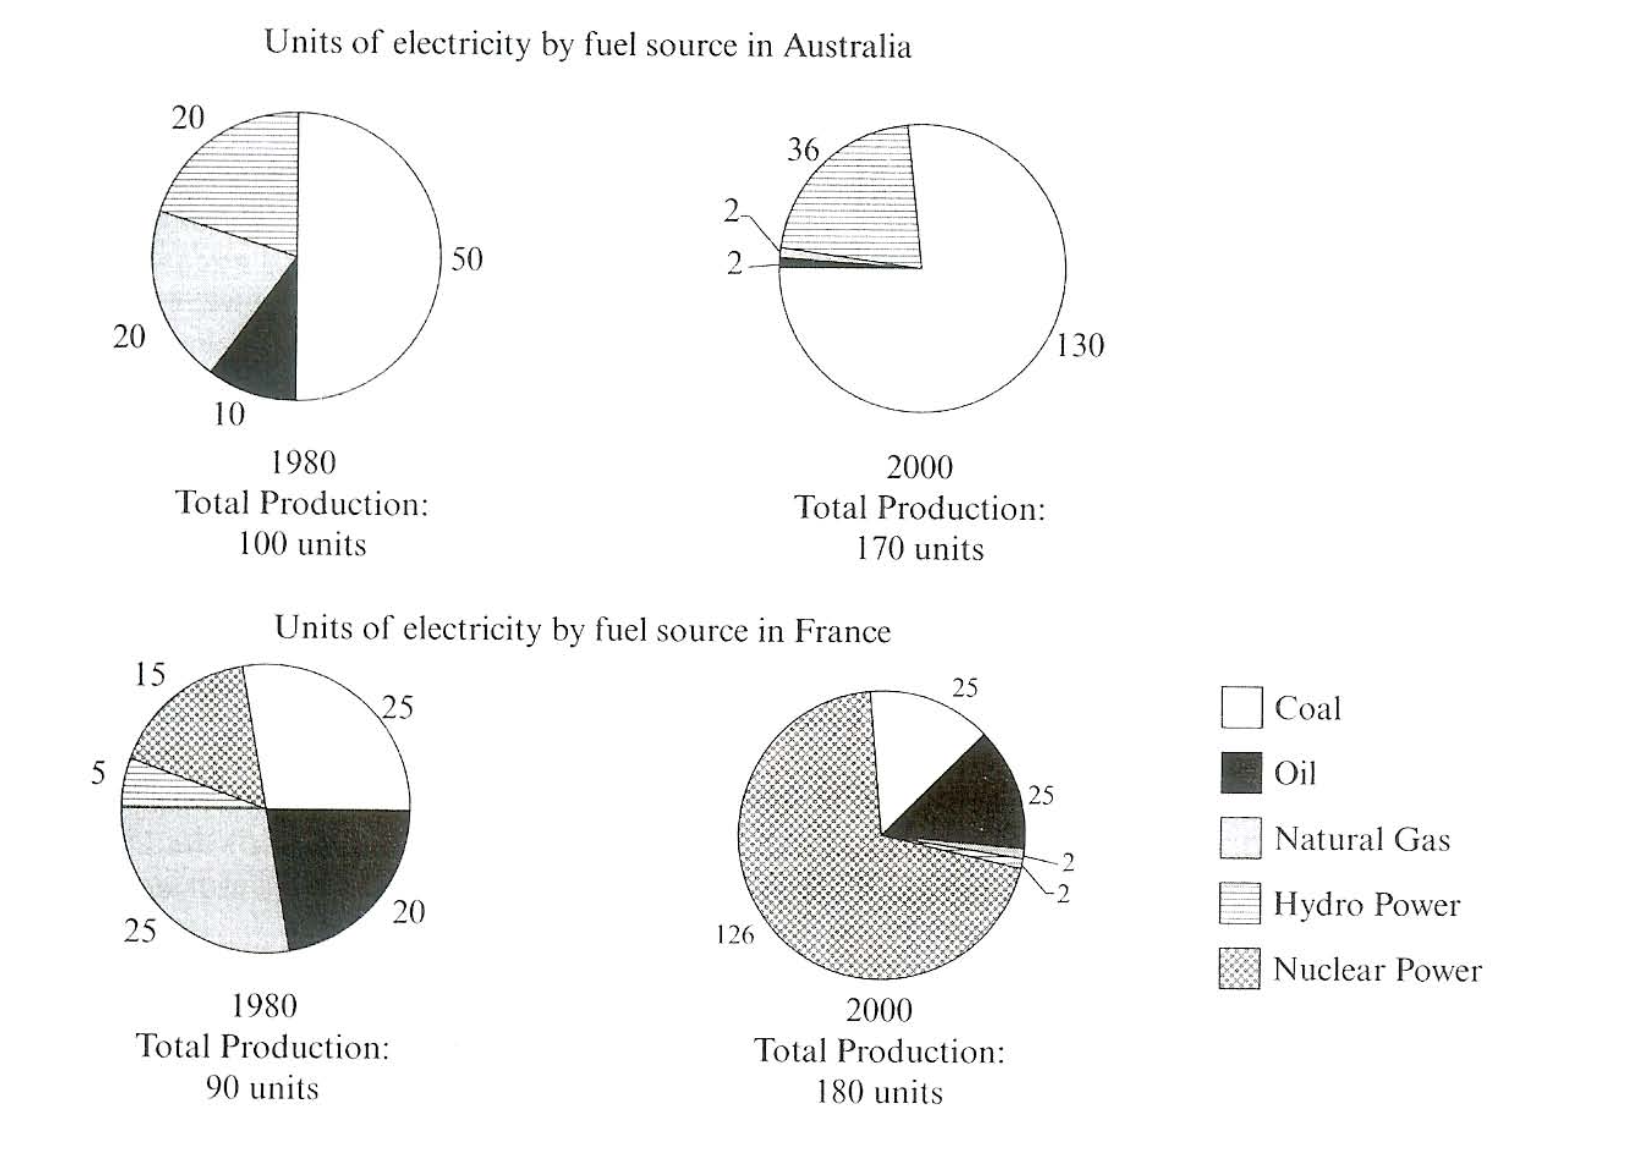
The pie charts below show units of electricity production by fuel source in Australia and France in 1980 and 2000. Summarize the information by selecting and reporting he main features ad make comparisons where relevant.
You should write a minimum of 150 words.
Source: Cambridge 7
Task answer
The given chart illustrates the information regarding the proportion of electricity generated from various sources in Australia and France during the period of 20 years, starting from 1980.
Overall, it can be seen that both countries saw an upward trend in total electricity production over the two-decade period. While coal reamined the domestic energy source in Australia, nuclear power emerged as the leading source in France by 2000.
Regarding the former country, the total electricity production in 1980 was 100 units, with coal accouting for half of that amount. Natural gas and hydro power each contributed 20 units, while oil was responsible for the smallest share at 10 units. By 2000, total electricity produced in Australia significantly rose to 170 units. Besides, coal maintained its positsion as the primary energy source among the others, producing 130 units, while other sources, such as natural gas or hydro power and oil, saw minimal contributions.
In contrast, France produced less electricity than Australia in the first year surveyed, with 90 units. However, the number of total electricity production surpassed that figure for Australia, reaching 180 units. The electricity generated from natural gas and coal was equally distributed, at 25 units each, while oild contributed 20 units compared to 12 units and 5 units of electricity produced from nuclear power and hydro power, respectively. By the final year, nuclear power became the dominant source in France, comprised 126 out of 180 units of electricity generated.
Word count:238