Writing report
academic IELTS Writing: Task 1
Overall score
7.50
7.5 of 9.0
Submitted on
Jun 21, 2025 (12 months ago)
Writing duration
0 minutes
Task description
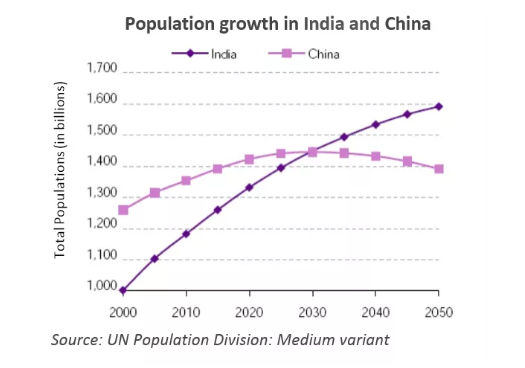
The graph below shows the population for India and China since the year 2000 and predicts population growth until 2050. Summarise the information by selecting and reporting the main features, and make comparisons where relevant. Write at least 150 words.
You should write a minimum of 150 words.
Task answer
The line graph illustrates the population growth in India and China from 2000 to 2050, including both recorded and projected data.
Overall, the population in India experiences continuous growth throughout the period, while China shows a slightly different pattern with an initial rise followed by a projected decline. by 2050, India's population is expected to surpass that of China.
In 2000, India's population started at around 1 billion. It then increased sharply to approximately 1,4 billion by 2020. In 2030, however, this figure is expected to surpass that of China and reach a peak at 1,6 billion by 2050.
Similarly, the population in China started at slightly above 1,2 billion in 2000 and was projected to reach a peak of around 1,4 billion by 2030. However, from that point onwards, this trend is expected to experience a gradual decline, falling steadily to just below 1,4 billion by 2050. Despite initially having a higher population than India, China's downward trend contrasts with India's consistent growth.
Word count:162