Writing report
academic IELTS Writing: Task 1
Overall score
8.50
8.5 of 9.0
Submitted on
Jun 27, 2025 (about 1 year ago)
Writing duration
95 minutes
Task description
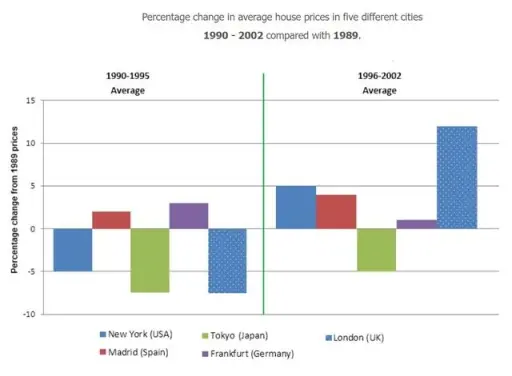
The chart below shows information about changes in average house prices in five different cities between 1990 and 2002 compared with the average house prices in 1989. Summarize the information by selecting and reporting the main features and make comparisons where relevant.
You should write a minimum of 150 words.
Source: Cambridge 7
Task answer
The following bar chart illustrates the percentage change in the average house costs in five different cities within the 12-year period, between 1990 and 2002, compared to those in 1989.
What can be concluded from the chart is that the proportional change in house prices varied between cities during the first 5 years; by the latter 7 years, all cities, except Tokyo, witnessed an increase in prices compared to figures in 1989.
Between 1990 and 1995, cities that observed a decreasing trend in costs were New York, Tokyo, and London, whereas Madrid and Frankfurt observed an increasing trend. The percentage drop in New York relative to 1989 costs was 5%, whereas those in Tokyo and London are relatively equal, at around 7.5%. Both Madrid and Frankfurt witnessed a no more than 5% rise in the price of accommodation, with Frankfurt having a larger rise compared to Madrid.
Even though the proportional change of house prices of the cities (except Frankfurt) increased between 1996 and 2002, Tokyo still had its costs less than that in 1989, with a percentage drop of 5%. London saw its house prices changed dramatically with its proportional change jump from -5% to way more than 10%. On the other hand, the accommodation prices in New York rose by 5% compared to those in 1989, whereas Madrid and Frankfurt still kept that no-more-than-5% increase streak. The difference is that Madrid had a larger rise than Frankfurt's.
Word count:236