Writing report
academic IELTS Writing: Task 1
Overall score
7.50
7.5 of 9.0
Submitted on
Jul 01, 2025 (about 1 year ago)
Writing duration
0 minutes
Task description
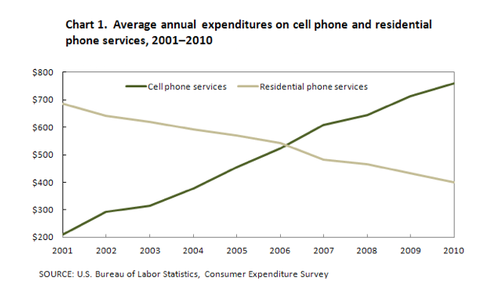
The graph below shows US consumers' average annual expenditures on cell phone and residential phone services between 2001 and 2010. Write a report for a university, lecturer describing the information shown below. Summarise the information by selecting and reporting the main features and make comparisons where relevant. You should write at least 150 words.
You should write a minimum of 150 words.
Task answer
The line chart compares how much dollars are spent on landline and private phone services yearly in a decade from 2001.
Overall, while the expense on cell phone services increased over the period examined, that of residential phone services experienced the reversed trend. Notably, the two figures converged between 2006 and 2007.
Concerning the personal phone services, it is clear that this gained much more popularity in this decade. In 2001, only more than 200 dollars were spent annually on this form of communication. Subsequently, its figure exhibited a consistent augmentation over the following years, surpassing the spending on the landline after 2006, at more than 500 dollars spent, and reached a peak of about 770 dollars in 2010.
Regarding the expenditure on landline, this figure witnessed a decreasing pattern. It once was the more popular service before 2006, with its most successful year being 2001, receiving nearly 700 dollars per a year. The figure then fell gradually to about 525 dollars in 2006, when it was overtaken by cell phone services, followed by an afterwards drop to 400 dollars in 2010 - the year which gained least profit in the period examined.
Word count:190