Writing report
academic IELTS Writing: Task 1
Overall score
7.00
7.0 of 9.0
Submitted on
Jul 06, 2025 (11 months ago)
Writing duration
0 minutes
Task description
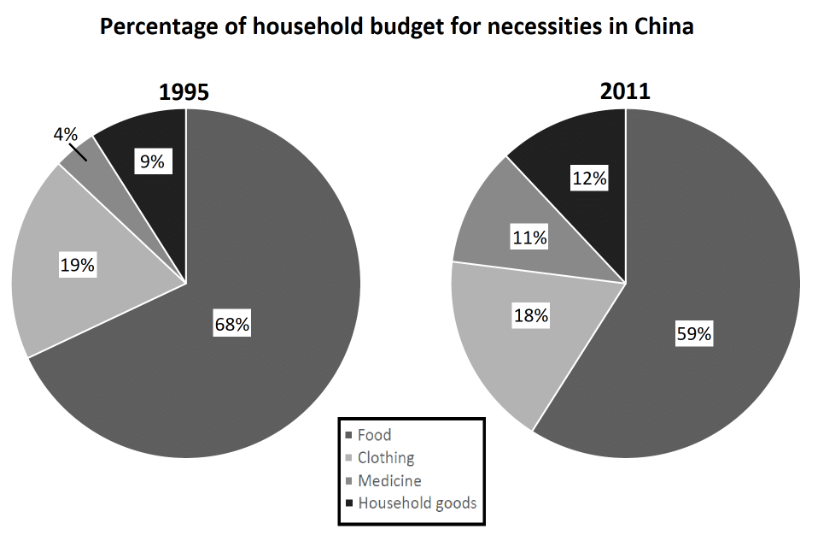
The chart below gives information about the household percentage of spending on essential goods in China for the years 1995 and 2011 Summarise the information by selecting and reporting the main features and make comparisons where relevant.
You should write a minimum of 150 words.
Task answer
The two pie graphs compare the Chinese share of expense on four different categories of necessities in 1995 and 2011.
Overall, while food and fashion received less financial allocations over the period, the figures for medical care and home goods increased. Despite experiencing such decline, food remained to be the most spent area in both years examined.
Concerning the decreased categories, their dominance still retained given such delining pattern. In 1995, while 68% of the household budget was spent on food, this proportion fell by 9% to 59% after 16 years, still accouting for the highest share. The figure for fashion and clothes witnessed the similar trend, but to a lesser extent, dropping slightly from 19% in 1995 to 18% in 2011.
Regarding the remaining spent areas, expense for both of them exhibited a progression. Medical care was the least spent category in both years, comprising only 4% and 11% in 1995 and 2011 respectively. Similar changes can be observed in the figure for common goods, which growed marginally from 9% in 1995 to 12% in 2011.
Word count:174