Writing report
academic IELTS Writing: Task 1
Overall score
7.00
7.0 of 9.0
Submitted on
Jul 06, 2025 (12 months ago)
Writing duration
0 minutes
Task description
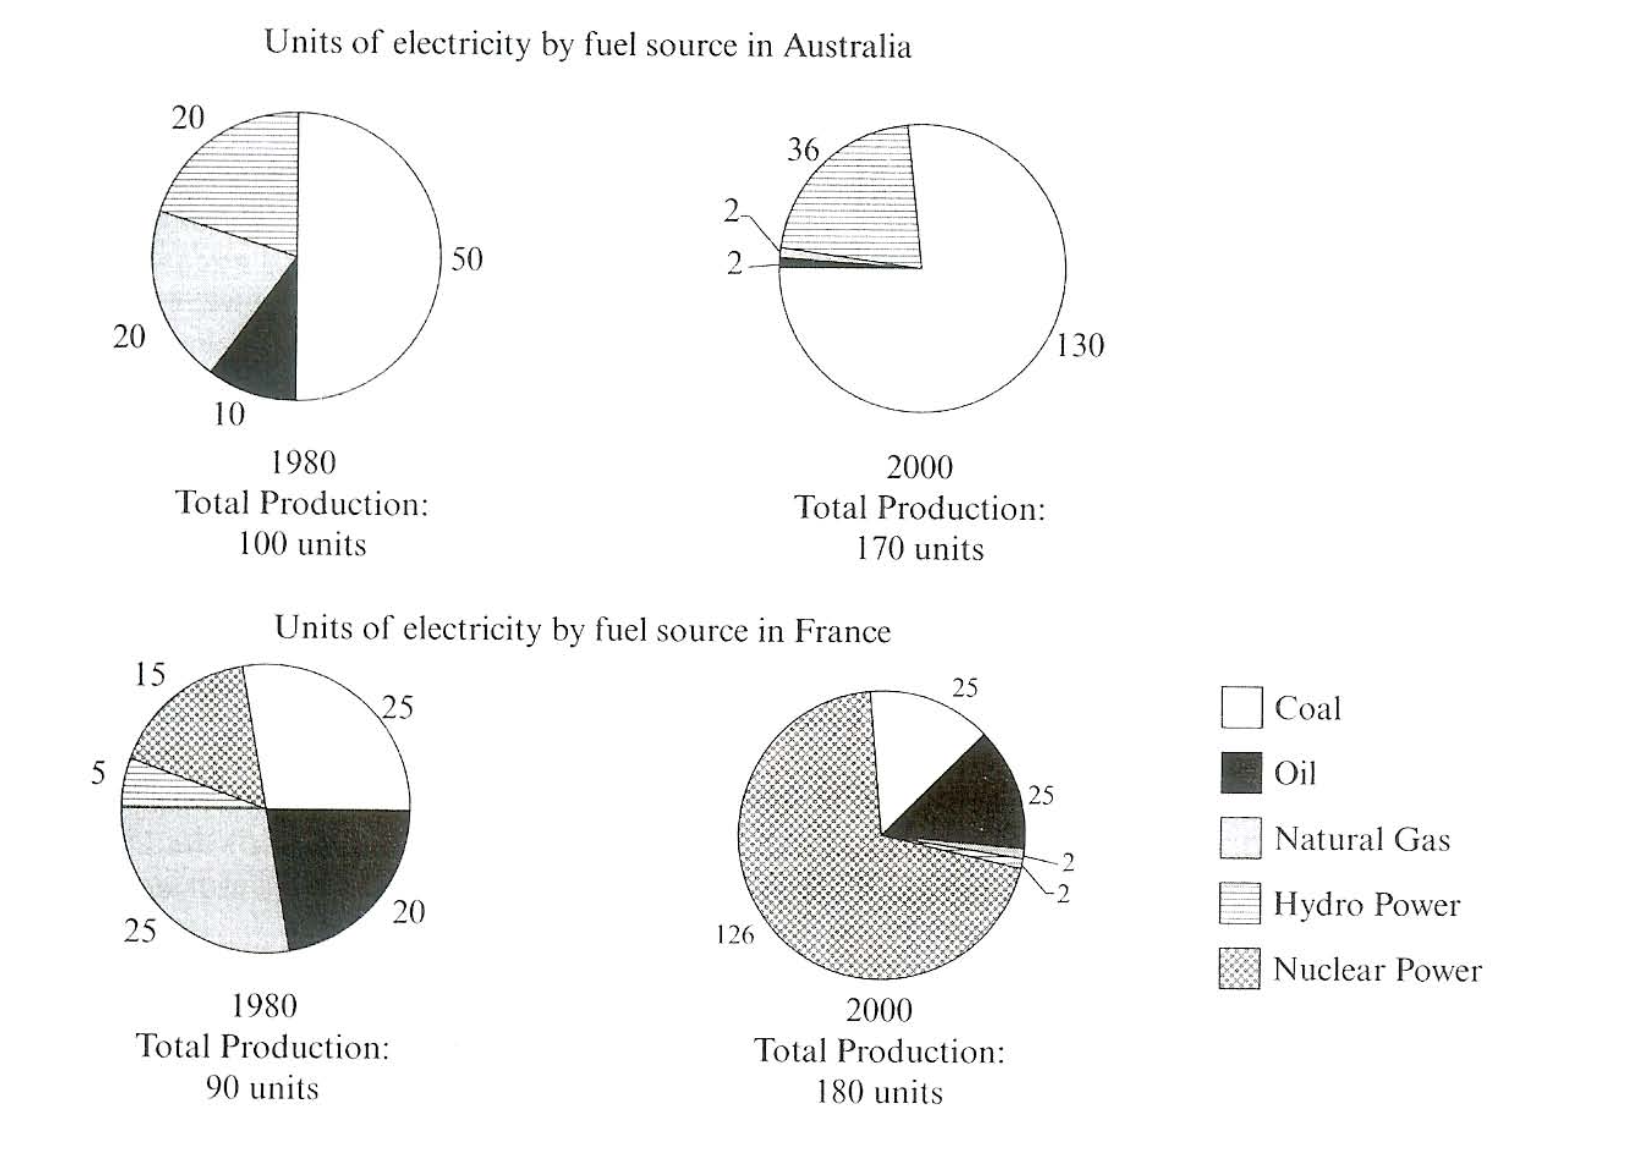
The pie charts below show units of electricity production by fuel source in Australia and France in 1980 and 2000. Summarize the information by selecting and reporting he main features ad make comparisons where relevant.
You should write a minimum of 150 words.
Source: Cambridge 7
Task answer
The pie charts compare the proportions of electricity generated from five different fuel sources in Australia and France in 1980 and 2000.
Overall, in 1980, coal dominated Australian fuel manufacturing in the both years, whilst France shifted from natural gas and coal to nuclear power over two decades.
In 1980, Australia generated 100 units of electricity, with coal accounting for its exact half (50) of the total. The remaining half was produced through hydro power, natural gas, and oil, with 20, 20, and 10 , respectively. France, meanwhile, generated 90 units of energy, with coal and natural gas possessing 25 each, followed by oil (20), nuclear power (15), and hydro power (5).
By 2000, coal almost tripled its size from 50 to 130, remaining as the Australian primary resource of energy, while natural gas and oil saw drastic declines, both reaching 2. Hydro power experienced a minor incline by 16. France's power output surged significantly to 180 units, but the structure of the proportions changed dramatically: nuclear power dominated at roughly three-quarters (126) of production, replacing oil and coal with 25 each. Natural gas and hydro power exhibited a dramatic decrease to 2.
Word count:191