Writing report
academic IELTS Writing: Task 1
Overall score
7.50
7.5 of 9.0
Submitted on
Jul 09, 2025 (12 months ago)
Writing duration
0 minutes
Task description
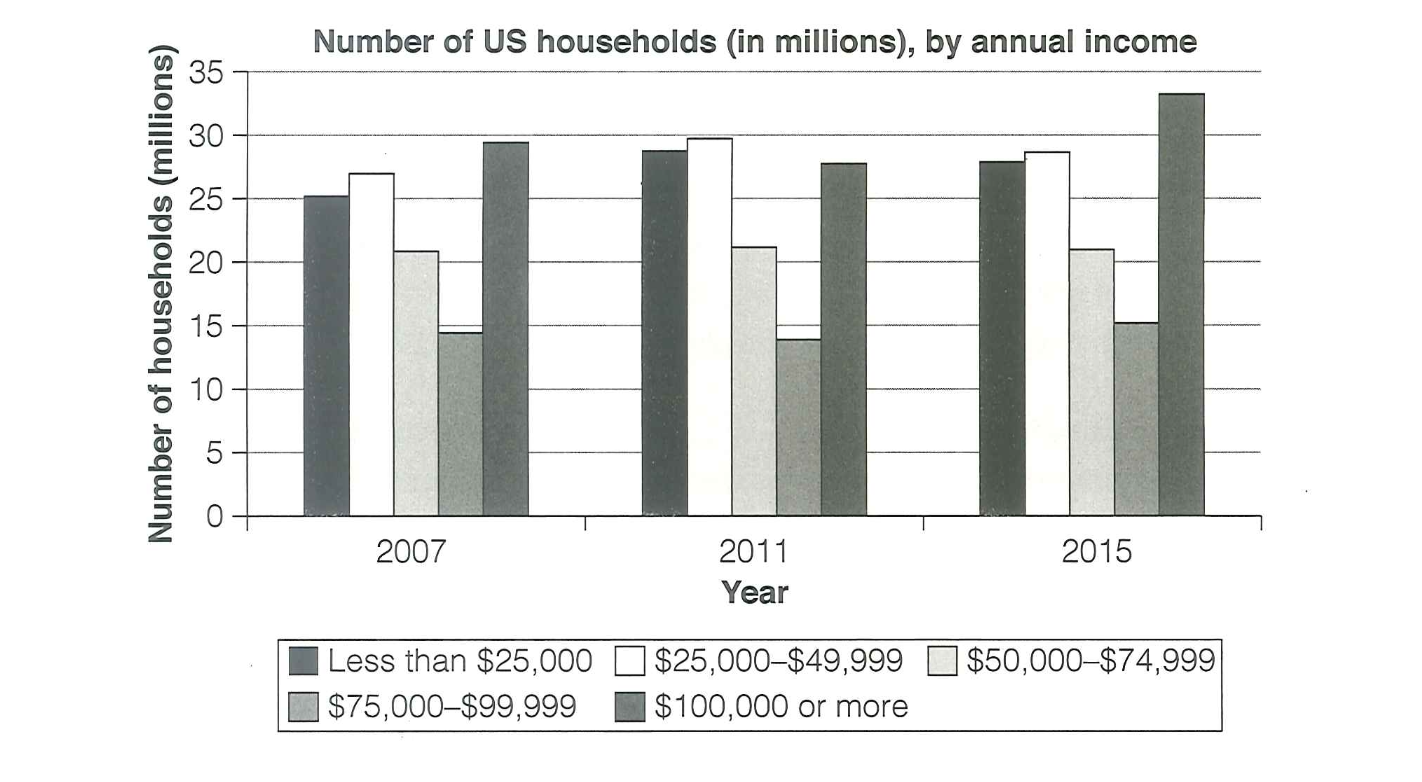
The chart below shows the number of households in the US by their annual income in 2007, 2011 and 2015. Summarize the information by selecting and reporting the main features, and make comparisons where relevant.
You should write a minimum of 150 words.
Source: Cambridge 18
Task answer
The bar chart illustrates the quantity of American households, categorized by their annual earnings, in 2007, 2011 and 2015.
Overall, The amount of highest-income households increased gradually, while lower income houses fluctuated with minor changes. The middle-income brackets remained relatively stable throughout the years.
The lowest income families experienced a gradual increase from only 25 million in 2007 to around 29 million in 2011, before slightly declining to 28 million in 2015. Similarly, the $25,000–$49,999 income bracket followed the same pattern, rising steadily from 26 million in 2007 to 30 million in 2011, and then falling back to its original level by 2015.
The middle-income households (50000-74999$ and 75000-99999$) remained comparably steady across the years, with just above 20 and 15 millions, respectively. Conversely, the number of +100000 group declined from 29 to 27 millions between 2007 to 2011. Although, this number surged significantly to roughly 34 millions in 2015.
Word count:147