Writing report
academic IELTS Writing: Task 1
Overall score
7.00
7.0 of 9.0
Submitted on
Jul 15, 2025 (12 months ago)
Writing duration
0 minutes
Task description
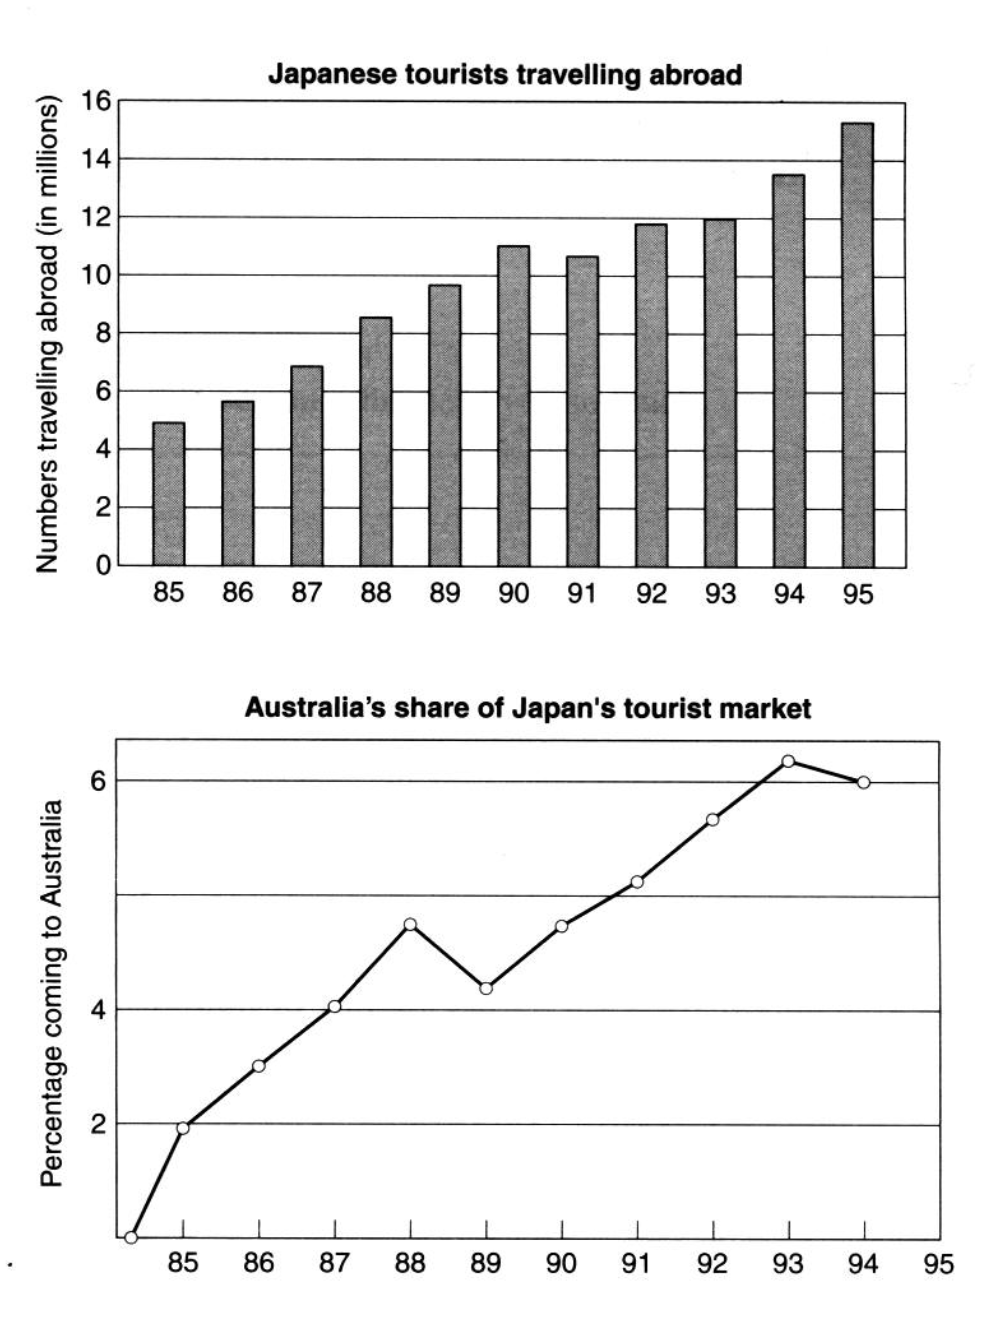
The charts below show the number of Japanese tourists traveling abroad between 1985 and 1995 and Australia's share of the Japanese tourist market. Write a report for a university lecturer describing the information shown below.
You should write a minimum of 150 words.
Source: Cambridge 3
Task answer
The first bar chart compares the Japanese number of foregin trips from 1985 to 1995. Meanwhile, the second line chart illustrates the share of this visiting Australia in the same decade.
Overall, it was clear that travelling abroad became gradually more popular over the period. Additionally, the proportion of Japanese tourists to Australia also witnessed a rise.
Regarding the first graph, an incremental trend was observed. In 1985, there were only 5 million Japanese travellers, which was the lowest number recorded throughout the period. In the following years, this figure steadily growed to 11 million in 1990, before slightly falling in the next year by approximately 0.5 million. Afterwards, there was a final progression to reach the number of nearly 16 million Japanese going abroad in 1995, being the highest figure shown.
Concerning the proportion of Japanese travelling market, Australia received an increased influx of tourists from Japan over the time examined. Before 1985, no Japanese was recorded to visit Australia. However, 2% of the Japanese tourist market were distributed to this country in 1985, after which this percentage rose to nearly 5% in 1988, before dropping below this level by nearly 1% a year later. Subsequently, Australia continued to have more Japanese tourists, with the share spiking to a peak of more than 6% in 1994, after which the figure marginally decreased to exactly 6% in the end.
Word count:226