Writing report
academic IELTS Writing: Task 1
Overall score
7.00
7.0 of 9.0
Submitted on
Jul 25, 2025 (11 months ago)
Writing duration
0 minutes
Task description
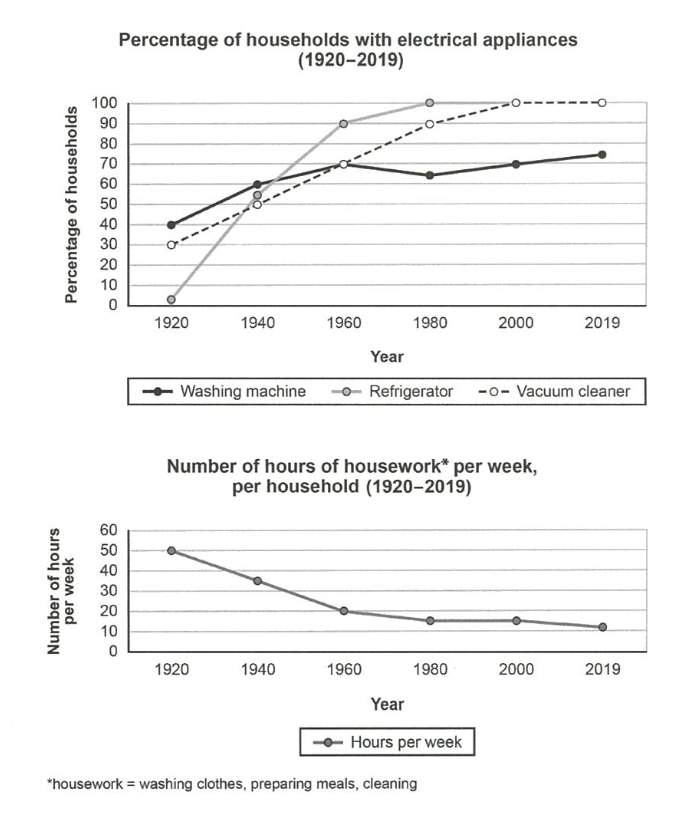
The charts below show the changes in ownership of electrical appliances and amount of time spent doing housework in households in one country between 1920 and 2019. Summarize the information by selecting and reporting the main features, and make comparisons where relevant,
You should write a minimum of 150 words.
Source: Cambridge 16
Task answer
The first line chart provides information on alternations in electrical appliances over a century, while the second chart illustrates the trend of spending time on housework per week, per household.
Overall, the chart demonstrates escalating trend of ownership for electrical appliances from 1920 to 2019, and aligning with this increase, the time on housework had notably decreased for a century.
In terms of possession of electrical appliances, washing machine was most popularly used by 40% of households. Similarly, around a third of families had vacuum cleaner at the outset. Meanwhile, refrigerator was barely introduced to common households, standing at only 2%. However, refrigerator demonstrated the most dramatic increase in ownership, taking over washing machine and vacuum cleaner shortly after 1940, and eventually remained at 100% since 1980.
Like refrigerator, more people started using vacuum cleaner since the beginning, and finally reached 100% ownership by 2000, largely contributing with refrigerator to decrease in housework hours from 50 to 10 by 2019. In contrast, despite the early popularity, washing machine experienced slow increase, even showing small decline between 1960 and 1980, and stopped at 75% of ownership in 2019.
Word count:184