Writing report
academic IELTS Writing: Task 1
Overall score
7.50
7.5 of 9.0
Submitted on
Jul 27, 2025 (11 months ago)
Writing duration
0 minutes
Task description
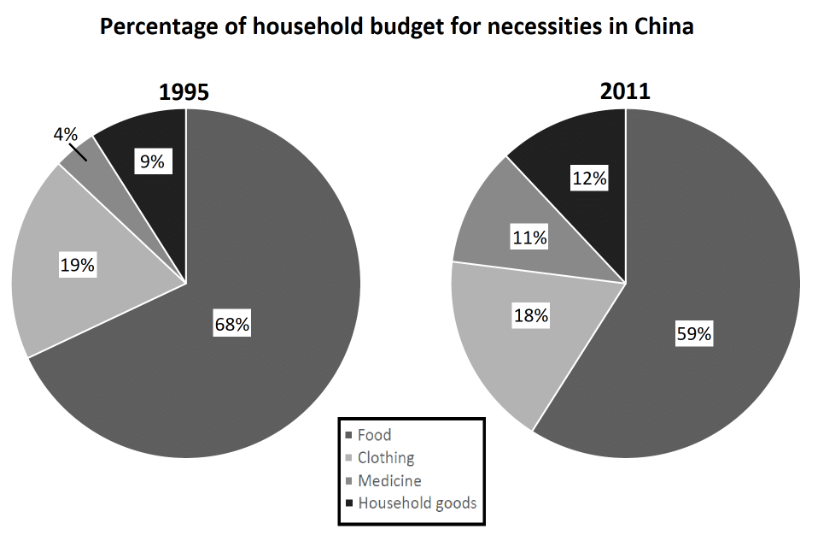
The chart below gives information about the household percentage of spending on essential goods in China for the years 1995 and 2011 Summarise the information by selecting and reporting the main features and make comparisons where relevant.
You should write a minimum of 150 words.
Task answer
The two pie charts illustrate the proportion of household expenditure on essential products in China in the years 1995 and 2011.
Overall, whereas the spendings on food remained the largest sector across the years, its portion declined significantly. In contrast, the shares spent on household products and medicine increased gradually, while clothing expenses saw a modest decline overtime.
In 1995, the amount of budget used on purchasing food accounted for the vast majority of the expenses at 68%, followed by a drastic decline by 9% to 59%, 16 years later. Despite this decline, it remained the most important necessity by far. In comparison, spendings on clothing also saw a minor fall from 19% to 18% over the 16-year period, maintaining its second position among the categories.
Conversely, housing items experienced a significant rise, growing from approximately 9% to 12% across the years. Notably, healthcare expenditure almost tripled its portion, increasing dramatically from a mere 4% to 11%, though this figure still remained the smallest part throughout the period.
Word count:165