Writing report
academic IELTS Writing: Task 1
Overall score
8.00
8.0 of 9.0
Submitted on
Aug 07, 2025 (11 months ago)
Writing duration
0 minutes
Task description
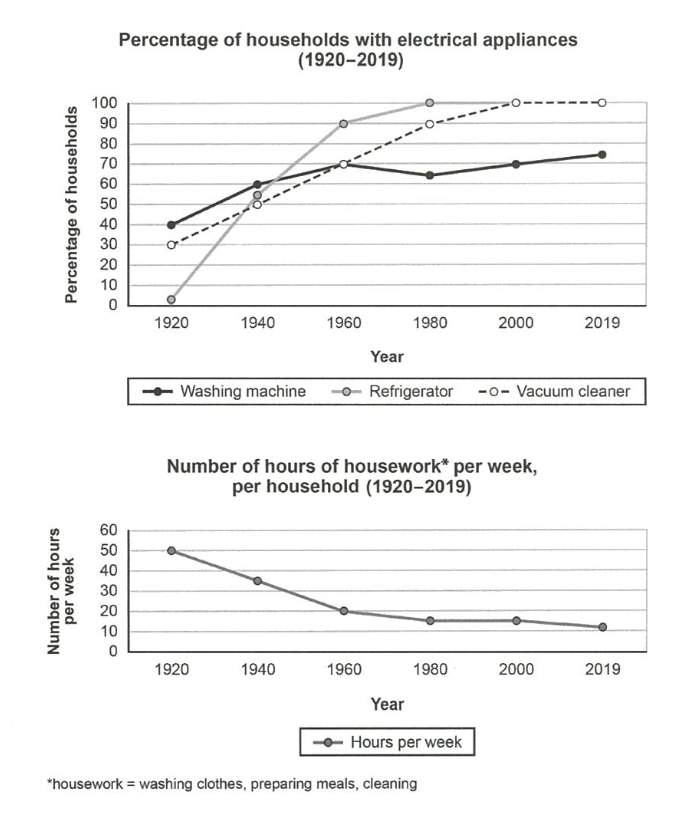
The charts below show the changes in ownership of electrical appliances and amount of time spent doing housework in households in one country between 1920 and 2019. Summarize the information by selecting and reporting the main features, and make comparisons where relevant,
You should write a minimum of 150 words.
Source: Cambridge 16
Task answer
The chart demonstrates the shifts in ownership of electrical appliances and the number of hours spent doing housework in a country from 1920 to 2019.
Overall, the ownership of electrical appliances rose significantly over the years, becoming an integral part of people's households. Number of hours of housework on the other hand, had a drastic decrease throughout the time period.
Starting off with electrical appliances, fridges were in 1% of households in 1920, before quickly gaining popularity and moving up to 55% in 1940, then 90% in 1960, in 1980 this number went up to 100% and stayed until the end of the period. Vacuum cleaners were in 30% of households in 1920, then 50% in 1940, this upward trend stays until 2000, where it is at 100% and doesn't go down. Washing machines start at 40% in 1920 then go on a noteworthy increase to 70% in 1960, before going down to 65% in 1980, then increasing again to 70% in 2000, and 75% in 2019.
Ever since 1920, the number of hours of housework per week has been decreasing time and time again, in 1920, 50 hours were being spend on housework per week, this number declines year after year, 35 hours in 1940, 20 hours in 1960, 15 hours in 1980 and 2000, and around 11 hours per week in 2019
Word count:221