Writing report
academic IELTS Writing: Task 1
Overall score
8.00
8.0 of 9.0
Submitted on
Aug 10, 2025 (10 months ago)
Writing duration
0 minutes
Task description
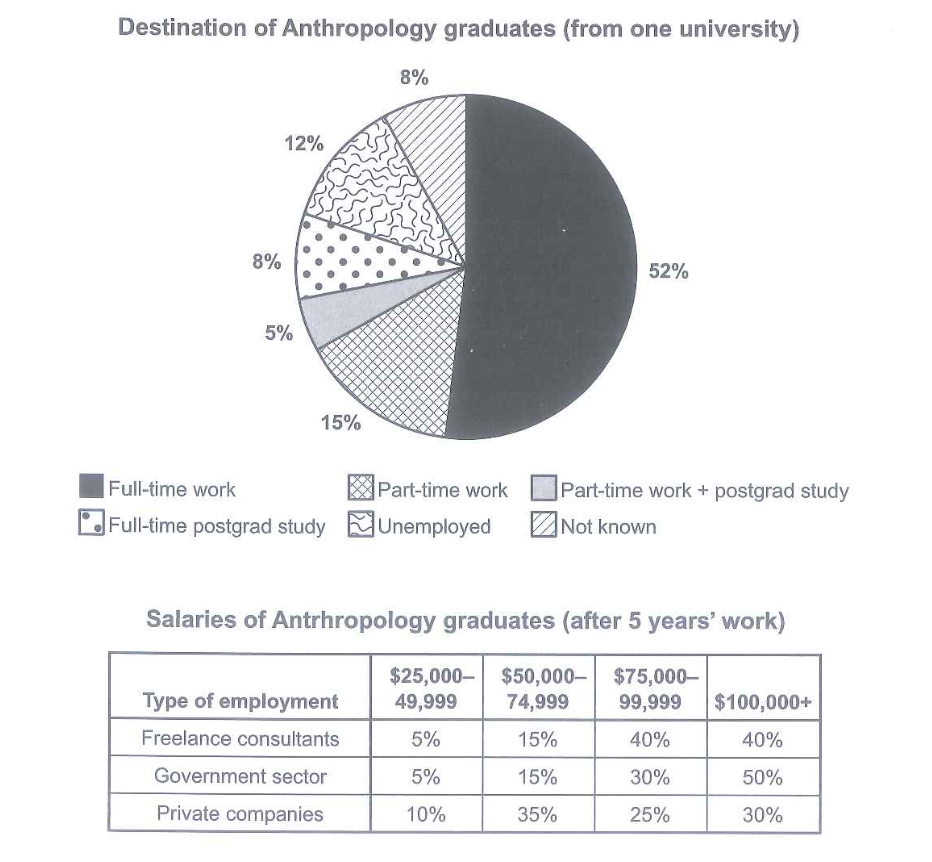
The chart below shows what Anthropology graduates from one university did after finishing their undergraduate degree course. The table shows salaries of the anthropologists in work after five years. Summarize the information bu selecting and reporting the main features, and make comparisons where relevant.
You should write a minimum of 150 words.
Source: Cambridge 15
Task answer
The pie chart illustrates what Anthropology students from a particular university did after graduating, whereas the table gives their incomes after five years of work.
Overall, the majority of students (over half) engaged in full-time work. Those who remained unemployed and those who took up part-time jobs comprised more than half of the remaining graduates. After five years, a significantly high proportion of freelance consultants and government sector workers earned the most.
The highest percentage of graduates, 52%, did full-time work, followed by those who were part-time workers and unemployed at 15% and 12% respectively. Additionally, 8% of them furthered their education by going into full-time post-graduate study. Likewise, what 8% did was unknown. Part-time work with post-graduate studies graduates comprised just 5% of the total.
Freelance consultants, who earned $25,000 - $49,999, were the least, with 5%, while 15% earned $50,000-$74,999, similar to government sector workers of the same income range. 40% of freelance consultants made $75,000-$99,999, the exact number as those who made $100,000 and above. This was not the same for government sector workers, who had 50% taking home a $100,000-plus and 30% making $75,000-$99,999. The biggest proportion of private company workers (35%) earned $50,000-$74,999. On the other hand, the lowest share earned $25,000-$49,999.
Word count:205