Writing report
academic IELTS Writing: Task 1
Overall score
8.00
8.0 of 9.0
Submitted on
Aug 10, 2025 (11 months ago)
Writing duration
0 minutes
Task description
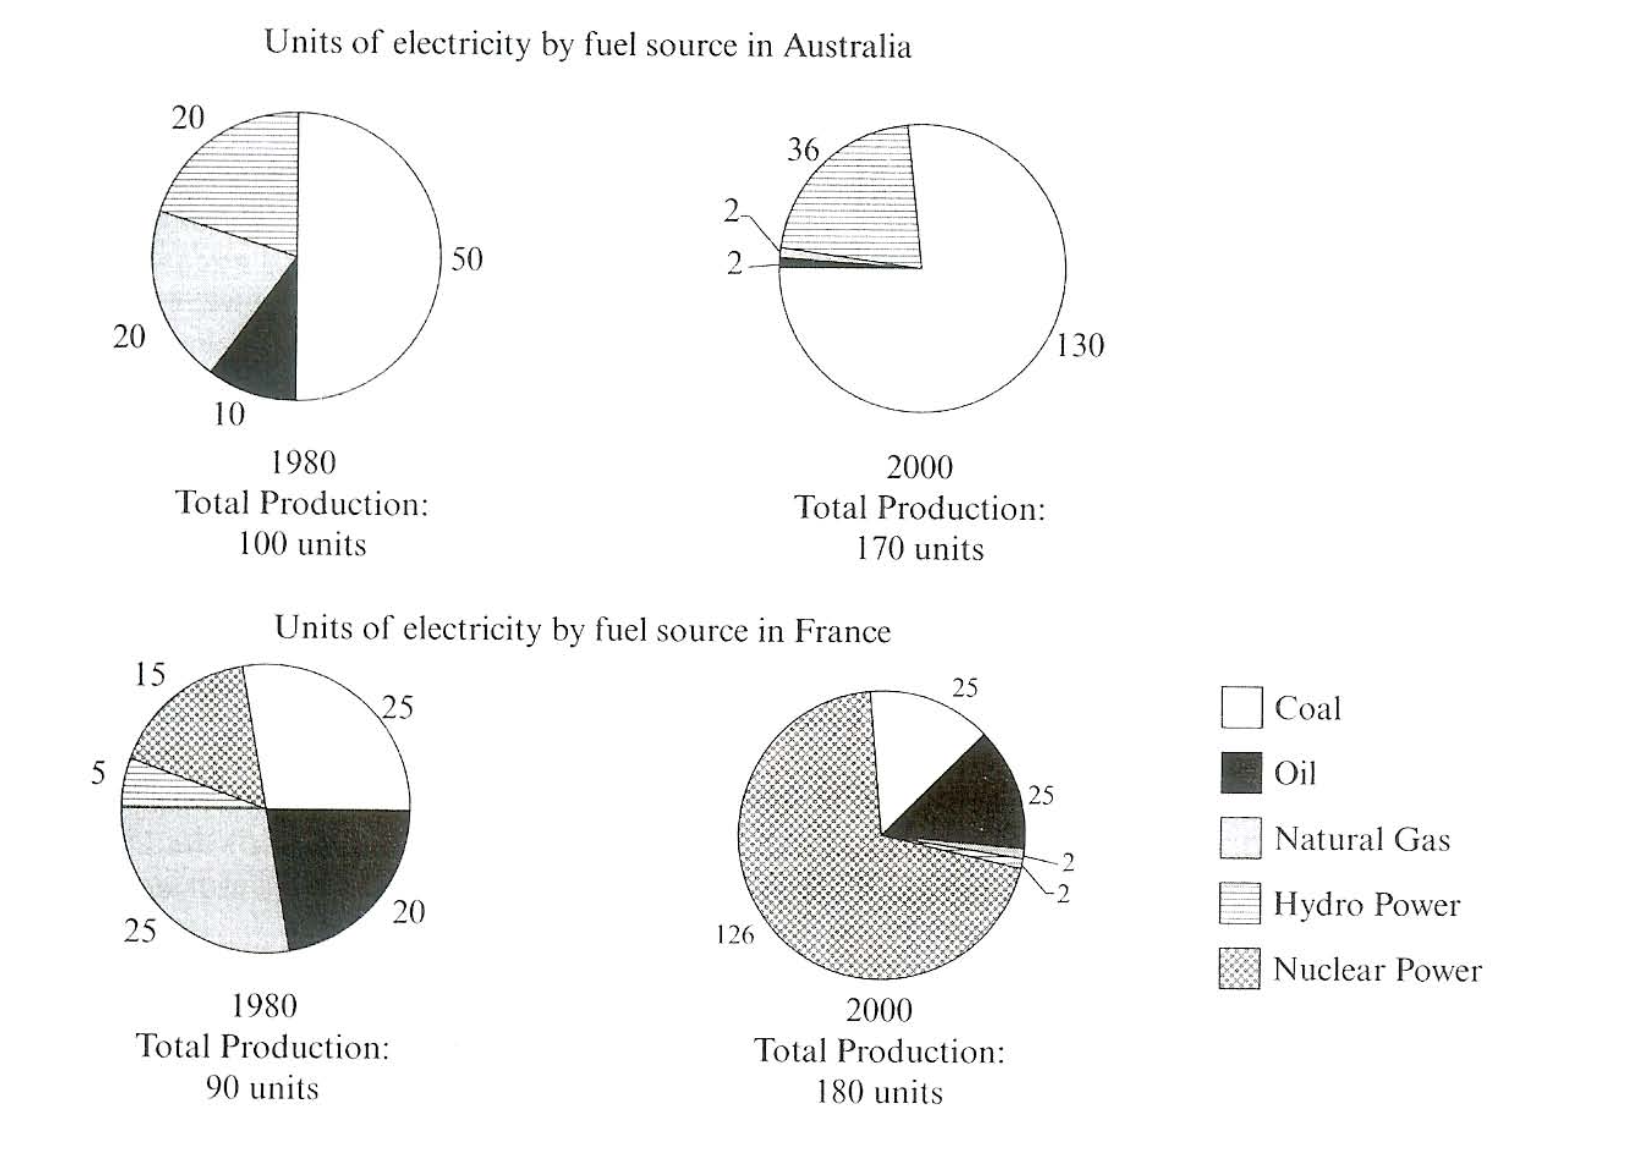
The pie charts below show units of electricity production by fuel source in Australia and France in 1980 and 2000. Summarize the information by selecting and reporting he main features ad make comparisons where relevant.
You should write a minimum of 150 words.
Source: Cambridge 7
Task answer
The charts illustrate the amount of electricity generated by different sources of fuel (coal, oil, natural gas, hydro power, and nuclear power) in Australia and France in the years 1980 and 2000.
Overall, in Australia, the unit of energy obtained from coal and hydro power increased over the period, while energy from natural gas and oil drastically declined. There was no energy generation from nuclear power, which was not the case in France, where energy production from Nuclear power went up significantly. In contrast, energy generated from hydro power and natural gas diminished.
In the year 1980 in Australia, energy production from Coal was exactly half (50) of the total energy production, before rising to more than double (130) in 2000. This is in contrast to France, where coal values stayed the same. Units from hydropower also climbed from 20 to 36 in Australia. In France, nuclear power experienced a massive upsurge from 15 to 126 units.
In Australia, power production from oil and natural gas decreased from 20 and 10 units, respectively, to 2 units each. Similarly, in France, hydro power and natural gas went down from 5 and 25 units respectively, to 2 units each.
Word count:194