Writing report
academic IELTS Writing: Task 1
Overall score
8.00
8.0 of 9.0
Submitted on
Aug 12, 2025 (11 months ago)
Writing duration
0 minutes
Task description
The chart below shows the reasons why people travel to work by bicycle or by car. Summarise the information by selecting and reporting the main features, and make comparisons where relevant. Write at least 150 words.
You should write a minimum of 150 words.
Task answer
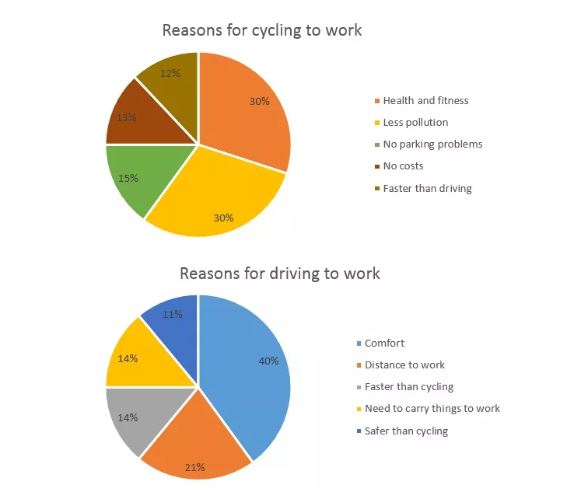
The given pie charts delineate the factors influencing people commute to work by two means of transport, namely bicycle and car.
Overall, it is readily apparent that health, fitness and less pollution are most prominent reasons for cycling to work, whereas comfort is the major reason for individuals to drive to work.
According to the pie chart of cycling, health, fitness and less pollution account for 30%, which were the dominant segment. 15% of the surveyed people ride bycicle to work since it is faster than driving, this figure was slightly higher than those whose reasons are no parking problems and costs, with 12% and 13%, respectively.
The driving pie chart illustrates that 40% of the people go to work by car thanks to its comfort, which outweighs other reasons' rate. The percentage of people who use their cars to go to work because of the distance to work is 21%, which is half of the figure of comfort. The rate of employees who need to carry things to work and who are of the thought that it is a faster choice is similar, at 14%. As it is safer than cycling, 11% of them drive to work.
Word count:195