Writing report
academic IELTS Writing: Task 1
Overall score
8.00
8.0 of 9.0
Submitted on
Sep 02, 2025 (10 months ago)
Writing duration
0 minutes
Task description
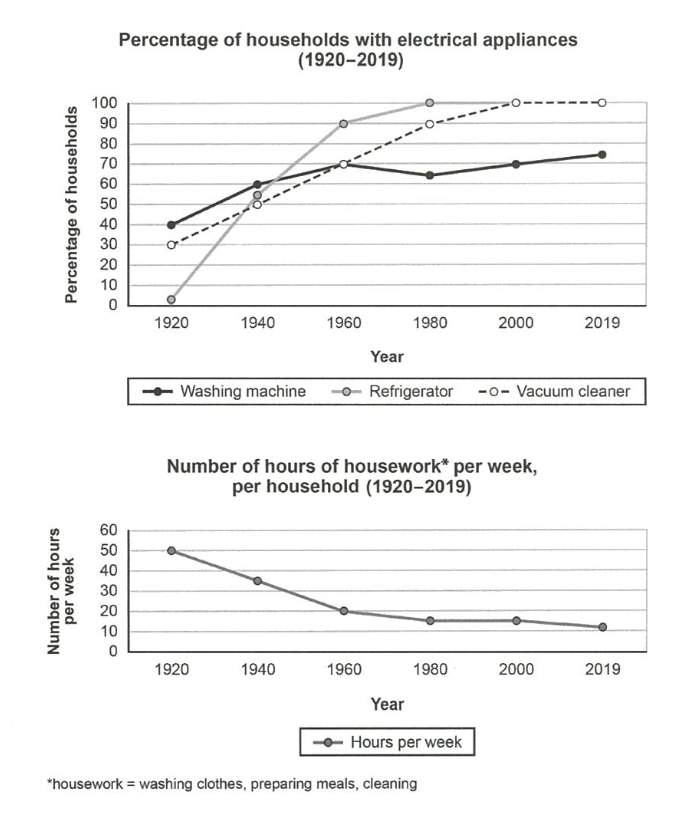
The charts below show the changes in ownership of electrical appliances and amount of time spent doing housework in households in one country between 1920 and 2019. Summarize the information by selecting and reporting the main features, and make comparisons where relevant,
You should write a minimum of 150 words.
Source: Cambridge 16
Task answer
Th graphs illustrate the percentages of households who has certain appliances, as well as the amount of hours per week spent on housework in a certain city between 1920 and 2019.
Overall, a decreasing trend is shown in the amount of weekly hours spent on household chores. In addition, there is an increase in the proportion of households containing electric appliances.
To begin, not only did refrigerators have the largest increase in the presence of households, going from approximately 1% of households in 1920 to becoming universal, but also rose to 100% the fastest, reaching it by 1980. On the contrary, not only did washing machines have the least rise in both absolute percentage, which peaked at 73% in 2019, but also the smallest increase over time, from 40% to 73%. In addition, there was a dip in the proportion of households with washing machines in from 1960 (70%) to 1980 (61%).
Furthermore, vacuum cleaners also became universal 20 years after refrigerators. However, nearly a third of households had vacuum cleaners in 1920, compared to the refrigerators which were semi non-existent at that time. With the rise of these appliances, hours spent on household chores steadily decreased over time, going from 50 hours to 11 hours weekly between 1920 and 2019
Word count:208