Writing report
academic IELTS Writing: Task 1
Overall score
8.00
8.0 of 9.0
Submitted on
Sep 05, 2025 (7 months ago)
Writing duration
0 minutes
Task description
The charts below show the levels of participation in education and science in developing and industrialized countries in 1980 and 1990. Write a report for a university lecturer describing the information shown below.
You should write a minimum of 150 words.
Source: Cambridge 3
Task answer
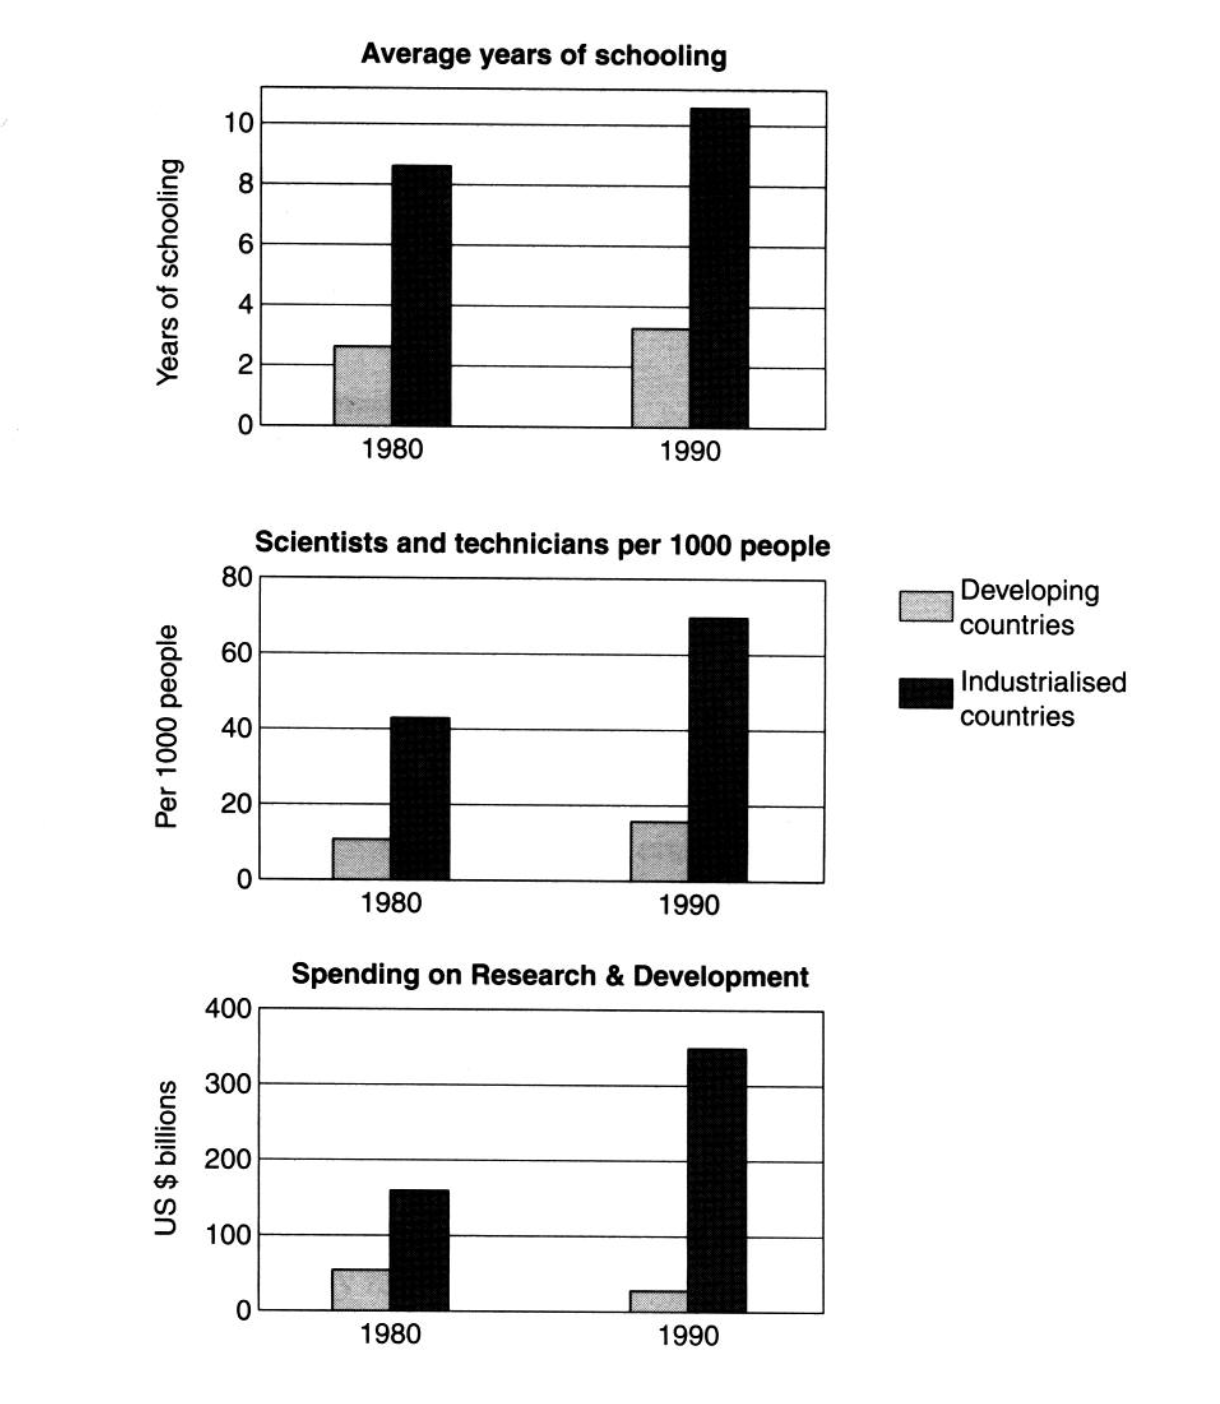
The graphs illustrate the average years of schooling, spending on research and development, as well as the number of scientists and technicians per 1000 people, in developing countries and industrialized countries in 1980 and 1990.
Overall, industrialized countries have higher levels and amounts across all categories, which increased from 1980 to 1990, compared to those of developing countries.
Initially, the average number of schooling years increased over time in both types of countries, with developed countries having a more significant incline, going from around eight years in 1980 to ten in 1990, compared to the one year increase from approximately two to three in developing countries. Furthermore, the number of scientists and technicians followed the same trend in both types of countries. For instance, the number of scientists and technicians rose from 41 to 65 per 1000 people through the time period, whereas they increased from 10 to 18 in less developed countries.
Finally, budget allocation on research and development had an enormous surge in developed countries, jumping from 150 billion US dollars in 1980 to 320 billion in 1990, more than doubling in value. On the contrary, spending on the same segment declined over time in less industrialized countries. Disbursement dropped from approximately 50 billion USD to 25 billion, cutting its previous value in half.
Word count:213